What the COVID-19 Positivity Rate Teaches Us
I am grateful to live in BC, with so many positive health factors in our landscapes to appreciate.
Let’s remember to unplug from our media and remember to cultivate an appreciation for the natural world.
To Sound the Alarm Again?
Most of us are paying close attention to the current situation of coronavirus case numbers reported by the BC government lab data, and displayed in all forms of media. We often hear reports of positivity rate, and I started to investigate what that number means.
What I keep reminding myself is to take a break from news and media, appreciate the outdoors and sunshine when I can. Also, to be aware of the health risks that undue stress plays on our health.
If you’re interested in reading more, check out my blog from last April, Alarm Reaction, Resistance, & Exhaustion
Here is what I’ve discovered from the BC data being reported by the BC laboratories.
Looking at the Data
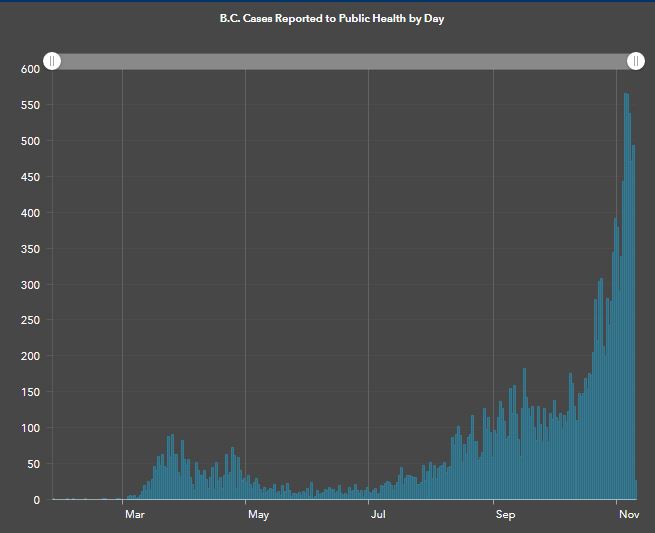
In the peak of the first wave, BC reports over 100 cases per days. In mid November, we are seeing over 550 per day.
At first glance this seems like a dramatic spike in the curve – over five times the total daily cases. Our cases began to hit 100 again into July and August, but with about half the positivity rate, so no big alarm was sounded.
B.C. Reported to Public Health by Day

British Columbia COVID-19 Dashboard
Here we can clearly see the “first wave” in this chart spanning from the beginning of March and culminating at the middle of June.
The Positivity Rate
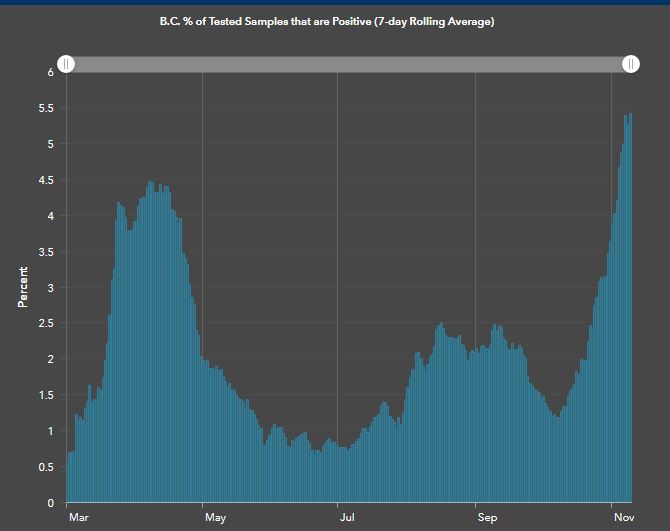
The positivity rate describes what percentage of total tests come back positive.
The total tests taken is the denominator in this equation. In other words, the amount of tests taken will change what percentage of tests are positive.
If we only test 1000 people, and we see 100 cases, our positivity rate would be higher than if we test 10,000.
So, the higher the positivity rate, the higher the percentage of tests taken that day come back positive.
B.C. Percentage of Tests that are Positive

British Columbia COVID-19 Dashboard
After the First Wave
During and after the first wave we start to see a massive increase in testing from high risk categories, like the elderly, and healthcare workers, to most of the general population vulnerable to possible outbreaks of the coronavirus, plus the general population that shows any signs of infection or are known to be exposed.
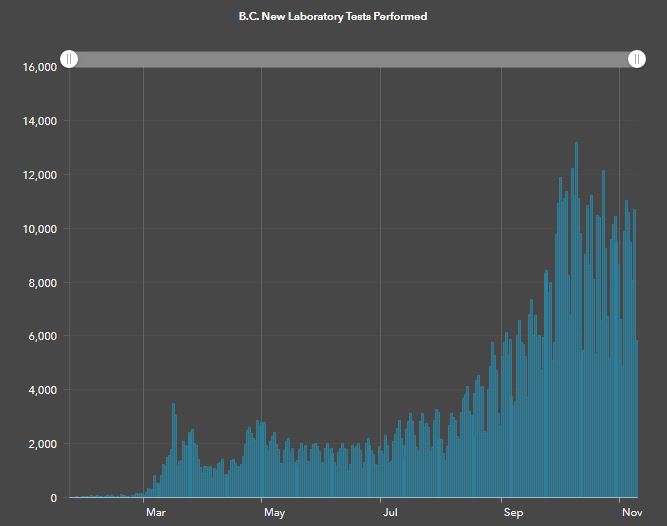
This rather large increase in daily testing means capturing more of the general population. Notice the dramatic rise in daily tests during the months of August and September, and then a massive surge in testing through October.
B.C. Daily Testing Rate

British Columbia COVID-19 Dashboard
Who we did not Count
If we cast a wider net we will capture more cases. During the first wave, our ability to capture tests results was limited by a single laboratory, and a wait time of two weeks. Now testing is widely available and depending on the region can be conducted in under 48 hours.
I think that we missed many of the people during that first wave who may have been infected with the coronavirus that we did not capture in the testing because we were telling people to shelter in place. Perhaps many more cases in fact did occur in the general population that we did not have the ability to test for.
I think that we need to take an increase in case numbers into context and look at the positivity rate. While we have many more cases test positive now, our positivity rate is not that much higher. Our testing rate has increased five times, where our positivity has only increased a one or two percentage points – not even doubled from March.
This is good news to me, and should be for all of us. As we watch our case numbers increase this winter, let’s remember that we are testing many more people than we did back in March. So if we are comparing these two waves in the chart, we can see how this second wave is being captured with a much wider net.


