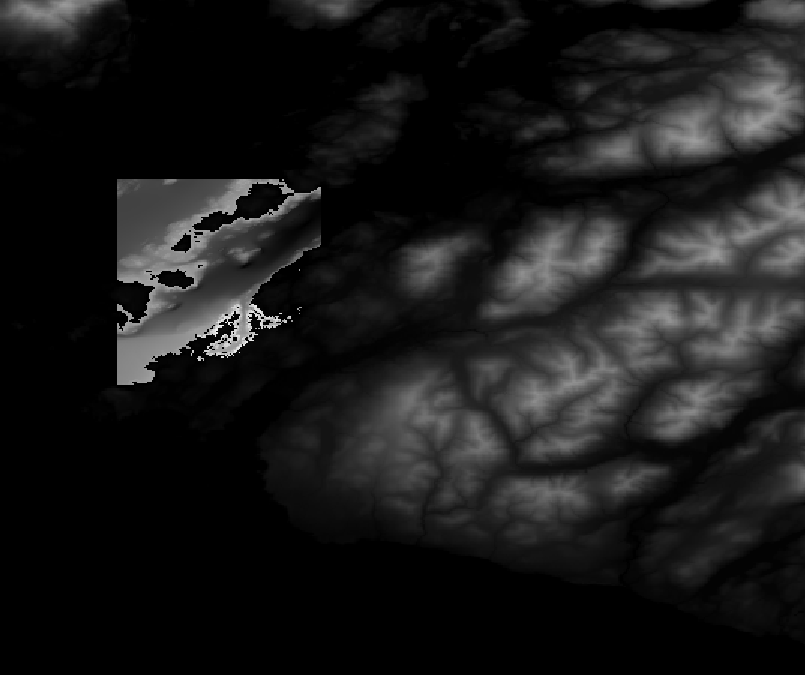
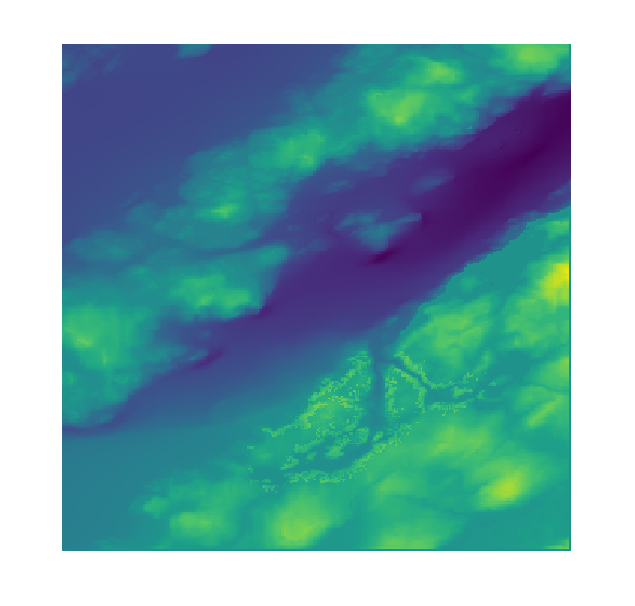
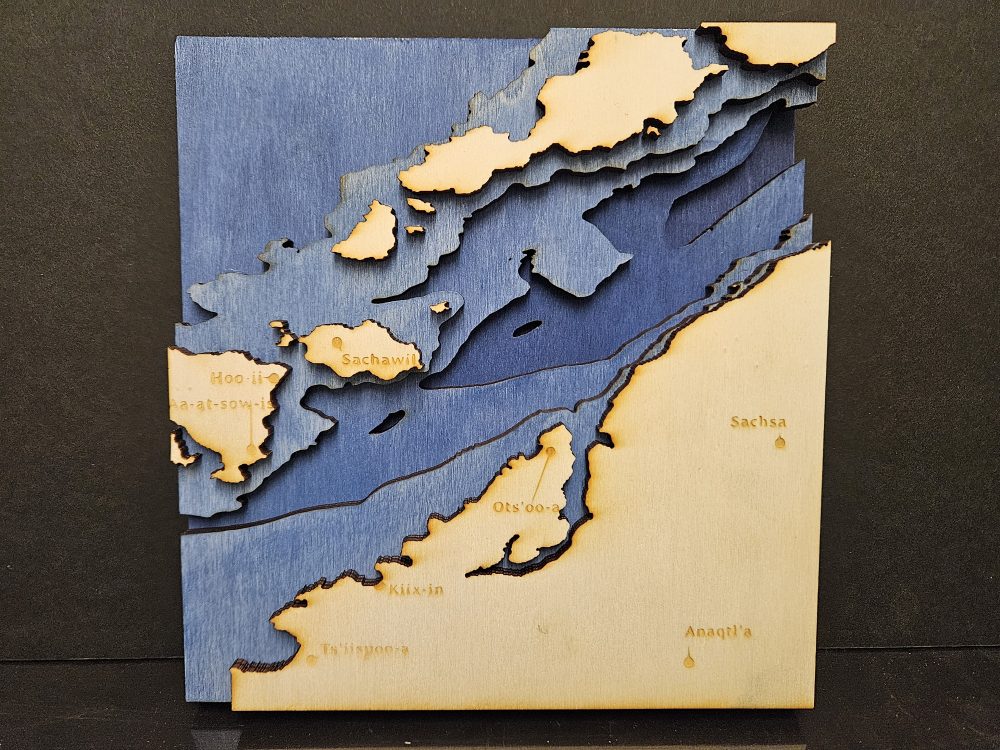
As part of my work-study position at the DSC, I have been using the laser cutter to make wooden bathymetry maps. Bathymetry is the undersea equivalent of elevation and is used in navigation, habitat classification, and tide predictions. It can also be used to make beautiful maps that reveal details about a part of our world that is usually hidden from view. The data used in this project is sourced from the Canadian government’s data portals, making it freely accessible to everyone.
The most important part of the process is to convert continuous raster datasets into vector lines that can be read by the laser cutter program. To do so, I use the open-source GIS software QGIS to merge and edit the data. When it has been processed, Inkscape is used to finalize the details and convert it into a file format that can be read by the laser cutter.
After being cut, I colour the ocean layers with wood stain and glue them down onto a base plate. The final result is a tactile, colourful map of ocean depths. Maps can be further customized by adding engraved placenames, streets, or topography.
If you are interested in learning these skills for yourself, this workshop will be available sometime in the new year! I hope to see you there.
Oliver James is a fourth-year Geography student specializing in geomatics. They are one of the DSC’s work-study students and enjoy merging technical and artistic skills.


