Cool Picture
or
Infographics and Language Learning
A picture is worth 1000 words. Never more accurate with Infographics! And INFOGRAPHICS ARE about words AND languages.
FULL Disclosure: I have zero artistic talent!
DOUBLE Full Disclosure: I once took an art class and … could barely sharpen my sketching charcoal!
I just missed out on a course about Infographics at the library yesterday. I am hoping they offer it again! And just what ARE Infographics? Well, according to Wikipedia:
Infographics (a clipped compound of “information” and “graphics”) are graphic visual representations of information, data, or knowledge intended to present information quickly and clearly.[1][2] They can improve cognition by utilizing graphics to enhance the human visual system’s ability to see patterns and trends.[3][4] Similar pursuits are information visualization, data visualization, statistical graphics, information design, or information architecture.[2] Infographics have evolved in recent years to be for mass communication, and thus are designed with fewer assumptions about the readers’ knowledge base than other types of visualizations.[5] Isotypes are an early example of infographics conveying information quickly and easily to the masses.[6]
All those cool combinations of statistics, images, ideas, trends and INFORMATION in one, easily understood picture! Literally, a picture is worth 1000 words!
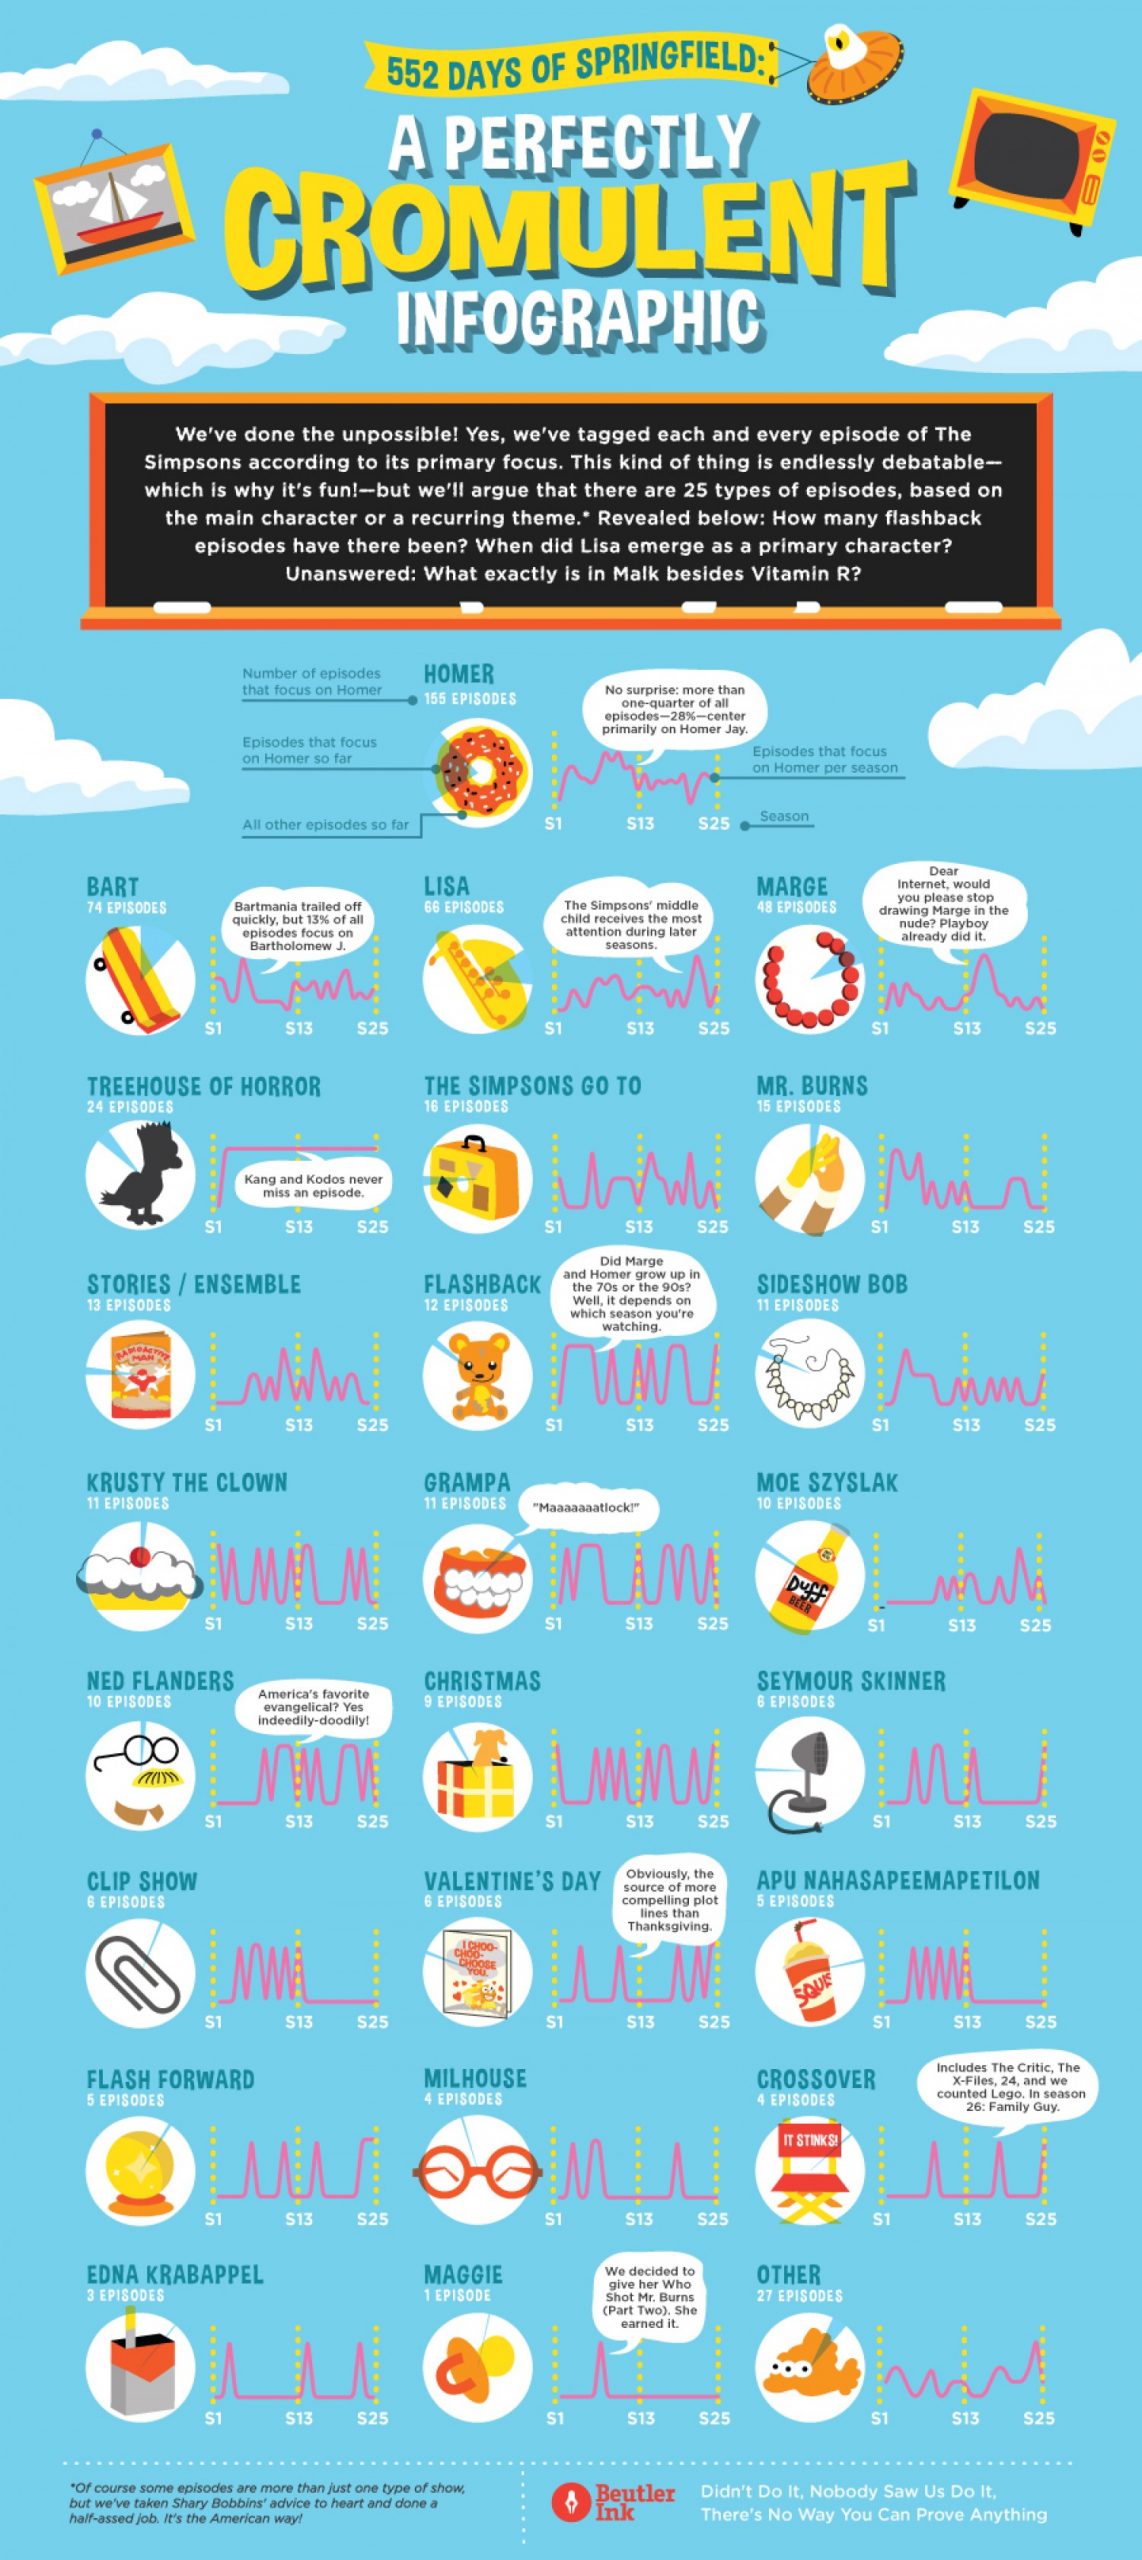
I have liberally saturated some posts with Simpsons gifs and memes, and I probably shouldn’t have been surprised to find some Simpson infographics! LOL!

But why use Infographics? Basically, and I am truly over-simplifying, but … we areALL students of VISUAL learning! Visuals can improve learning by over 400%! AND ‘The average person can recall 65 percent of visual information ten days later (only 10% of what they heard)‘. Those are astonishing numbers for success in learning … ANYTHING and EVERYTHING!
Confucious was right ….”I hear and I forget. I see and I remember. I do and I understand.”
The topic of student teaching (practicums) came up at Digital Coffee today and the best and most powerful teaching lessons I remember, not only when I was a student teacher, but also AS A STUDENT, were always the most visually stimulating, interesting and sometimes, confusing lessons! But their impact is long-term, at least on me!
Oh, the stories that … could be a future OAC post about teaching ‘BG’ …. that is short for … BEFORE GOOGLE! LOL! Or even ‘BtI’ – Before the Internet!
Yup, I grew up when Amazon was ….. a river! And Social Media required … leaving the house!
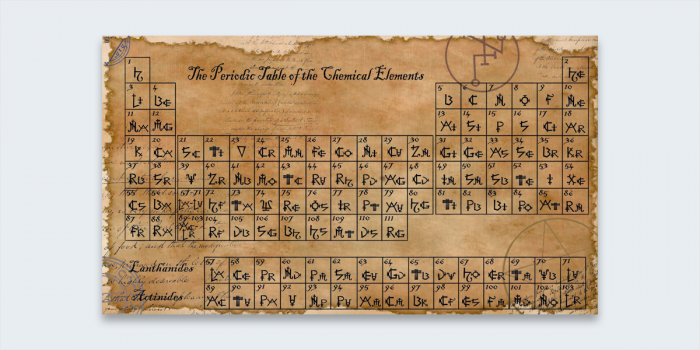
And one of the most famous of ALL Infographics is something ALL of you have studied in school, potentially from about Grade 6 on … maybe even earlier – Mendeleev’s Periodic Table, 1869!
And I also discovered some ANIMATED Infographics, which takes visual learning to a whole new level! Okay, so the last one is a .. penguin! LOL! I bet you will remember THAT one, if only because it is such a black and white issue!
Click on each one to open in a new tab.

And the usual assortment of recently searched interesting links, videos and other cool stuff – but beware, you may now have an overwhelming urge to discover a new element and add it to the Periodic Table!
Enjoy!
- Infographic – Wikipedia
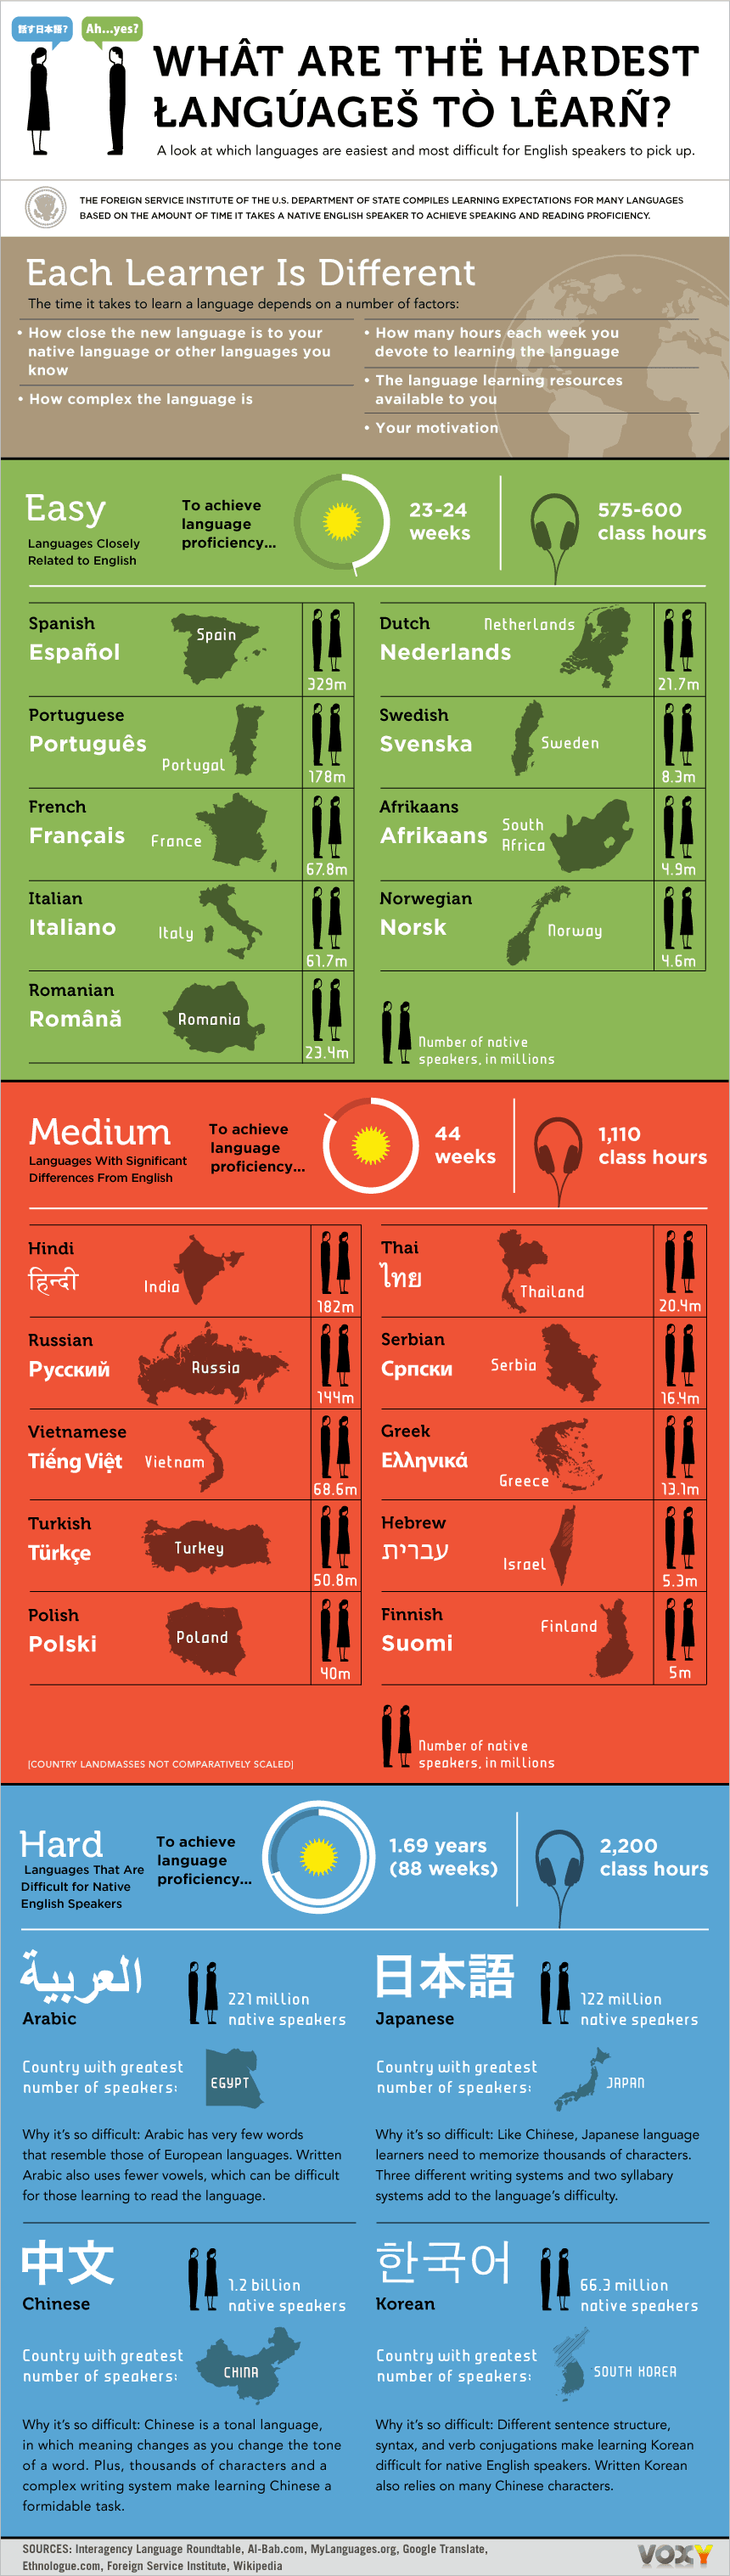
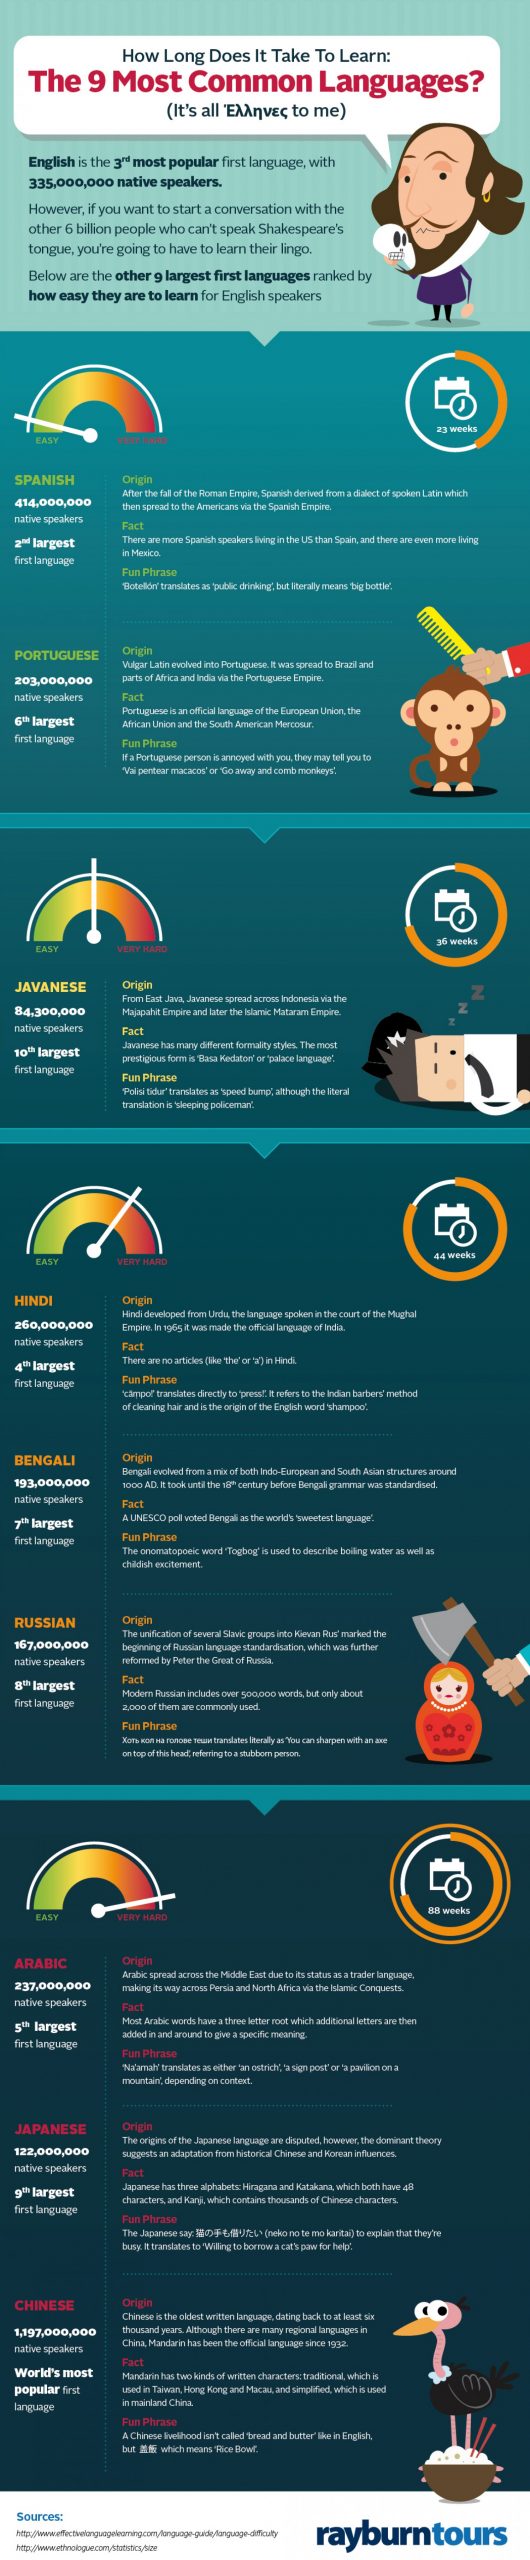
- 5 Language Infographics
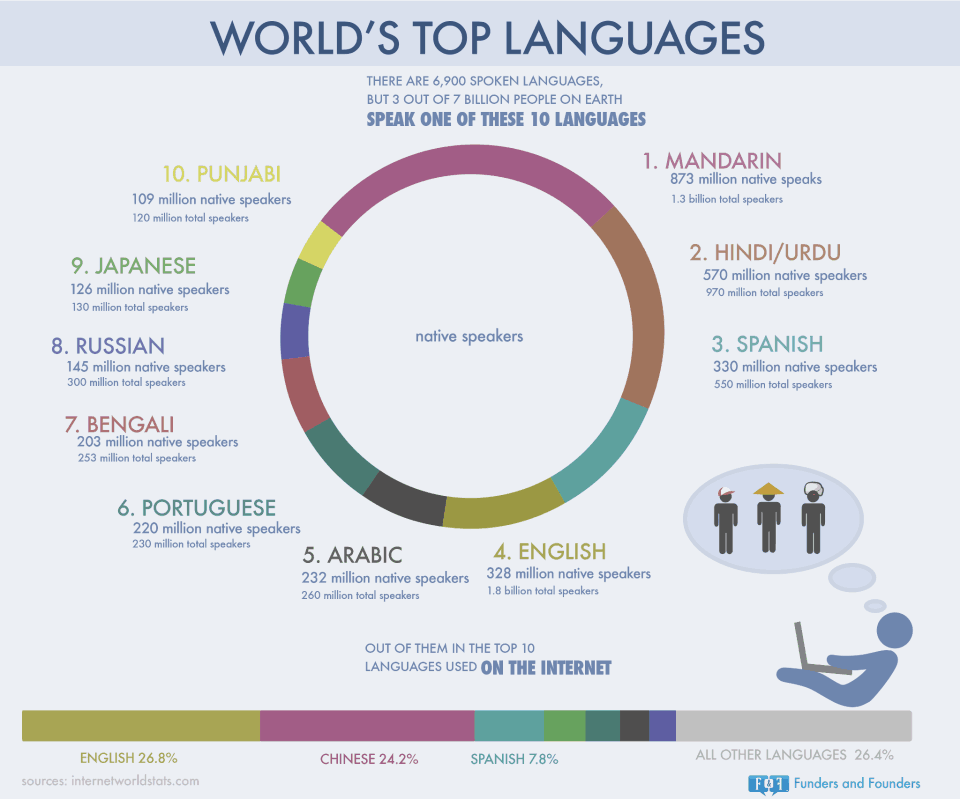
- All the World Languages in One Visualization
- Infographics on Canada’s official languages
- Infographic: Benefits of Language Learning
- The Best Language Infographics & Interactive Tools on the Web
- 6 Language Infographics for National Foreign Language Week
- National Foreign Language Week
- 50+ Fascinating Language Facts You Didn’t Know
- INFOGRAPHIC: The world’s most spoken languages and where they’re spoken
- Infographic: A World Full of Languages
- The World’s Most Spoken Languages
- Language infographics – Pinterest
- The Simpsons: 30 Years Young – Infographic
- 6 Reasons Why I Won’t Look at Your Infographic
- Why infographics matter in the classroom
- 12 Groundbreaking Infographics That Changed the World
- A Collection Of The Best Infographics
- Life before Google: What was it like?
- 15 Examples of How Different Life Was Before The Internet
As long as there are words out there, there will be interesting topics!
ENJOY!

TTFN!
Using Visual Language
in Infographics
Infographics
How to Learn a New Language
10 Easiest Languages
to Learn
Most Popular
Programming Languages to Learn
1965 – 2019