We start our journey by visiting the mainstem of the Xwulqw’selu Sta’lo (the river). Next, we travel on to:
- Glenora Creek
- Kelvin Creek
- Patrolas Creek
- Norrie Creek
- Neel Creek
- Heatherbank Brook
- Five first order streams along Riverside Road
- Wild Deer Creek and Fellows Creek
Need some help locating the creeks and streams? Refer to this map as we skip and dip along the waterways.
Note: It may take a moment for the page to load. This map offers a sneak peek at specific conductivity data. We will continue to refine and update the data and graphs over time. The names of the sites on the map and the graphs are only used in this project. The names we use to identify these sites could change in the future or they may remain the same.
Need a refresher on useful terms and concepts? Refer back to these Streamflow Snapshots we published earlier this summer:
In Streamflow Snapshot 2 you will find useful definitions for terms like: surface water, groundwater, aquifer, gaining streams, losing streams, and connected streams.
In Streamflow Snapshot 3, learn how specific conductivity trends can indicate how and where surface water and groundwater mix and move in place and over time.
In Streamflow Snapshot 4, we explain how to read line graphs and understand what the trends tell us. The changes in specific conductivity help us understand the river’s reliance on groundwater through time.
In Streamflow Snapshot 5, discover how stream temperature trends can indicate tributaries’ changing reliance on groundwater over the summer.
Connect the Dots: Reading Data on the Graphs
As we take our watershed tour, we stop to look at graphs that show changes in temperature and specific conductivity of stream water at several sites over time. Our task is to connect the dots! We can do this in two ways:
- we can use our fingers or eyes to connect the dots on the graph, and
- we can then spot trends that indicate whether the streams are gaining streams, losing streams or disconnected streams.
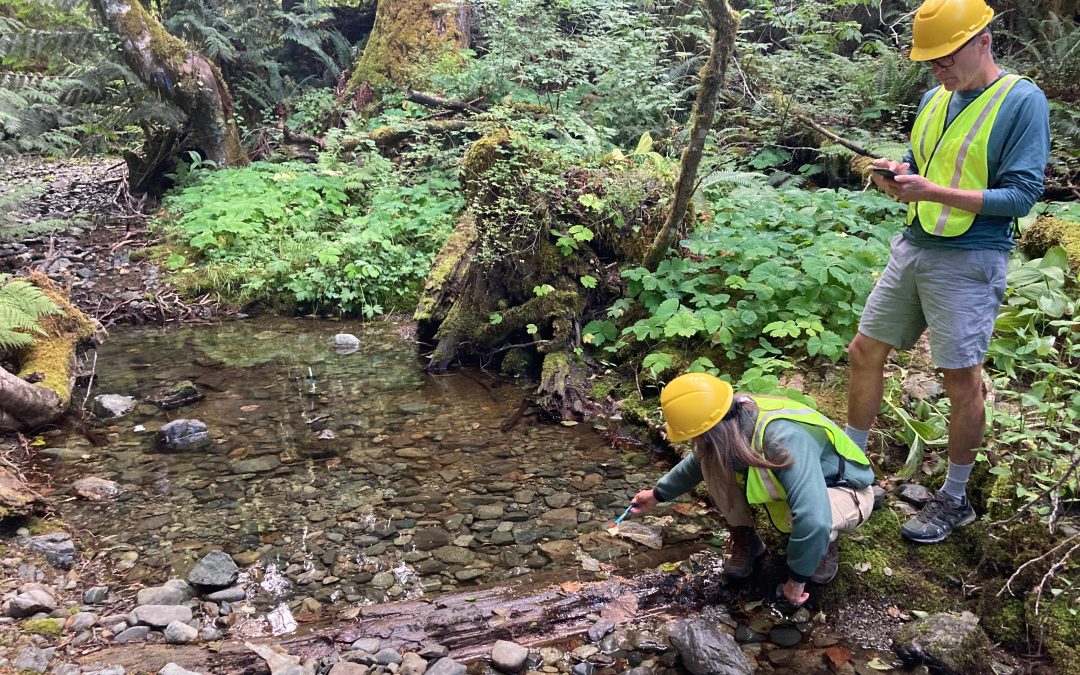
From June through September, Xwulqw’selu Connections Stream Team monitors from the community recorded the temperature and specific conductivity of stream water at sites throughout the watershed. PhD Candidate Kristina Disney prepared graphs that plot the data as dots on a graph. Each dot reflects data gathered on a specific day.
Stream Teams took turns visiting a group of sites every week. Kristina visited all of the sites every month. If there are two dots close to each other on a graph, or one dot is above another, that shows that visits were close in time to one another – perhaps within 24 hours or within one or two days of each other.
When we look at the graphs, we are not concerned about small differences we see in the placement of the dots on the graphs. We are looking for trends in the data over time. As we connect the dots, we might see wild spikes and wonder: is there a dot (data point) out of place? Weird things do happen! Outliers can be either true anomalies or data entry errors.
The outliers could be due to a weather event (like rainfall), or small-scale local pumping, or other potential unknowns. Outliers could also be due to small mistakes, like entering data in the wrong field site in the Anecdata app, forgetting to enter a decimal point, or swapping the temperature and specific conductivity fields when typing data into the app. We can expect some variation. The digital pens used for reporting the data have an acceptable range of error that is within + or – 5 microSiemens (uS) in precision.
Data clean-up is part of science work and will be forthcoming. We can look at data from more than one source (including photographs, datalogging equipment installed at a small number of sites, and Kristina Disney’s observations) to assess outliers and correct mistakes in the data gathered by community members.
Kristina will assess the “wild spikes” and make corrections to the graphs when she completes the data clean-up work. That said, the basic trends we spot give us a sense of what is happening, and it is already valuable to interpret these trends.
Xwulqwselu Sta’lo: Mainstem
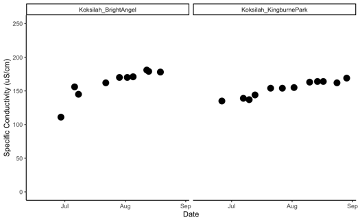
We start our tour at Bright Angel Park then continue on to Kingburne Park. At these mainstem locations, the temperature of the river water fluctuates, and the specific conductivity increases over time. Take a look at the graphs below.
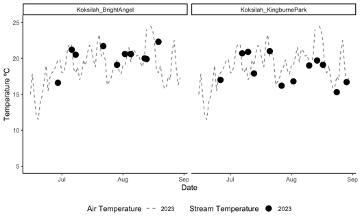
Large rivers like the Xwulqw’selu tend to have a greater capacity for absorbing heat than smaller rivers as there is a greater volume of water. This behaviour makes it more challenging to interpret data about the water temperature here than in the river’s relatively smaller individual tributaries. However, trends in the data we gathered are consistent with general trends in previous work (Sivak & Wei, 2019)
The temperature and specific conductivity trends suggest two things about the lower reaches of the river in these parks:
- A mix of water sources flow into the river (from surface runoff, shallow groundwater, and deep groundwater)
- The river here is a losing stream
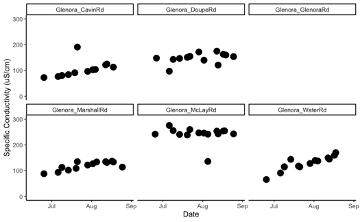
Glenora Creek
Our next stop is at Glenora Creek. This creek shows similar characteristics to what we noticed at Bright Angel Park and Kingburne Park: the water temperature is variable over the summer and the creek is fed by a mix of water sources.
Take a look at the graphs below which show the temperature and specific conductivity trends at six sites along the creek.
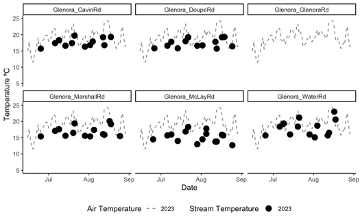
You may be wondering: why is the stream temperature data missing at the Glenora Road site? The reason is that there was no water at that site during the entire monitoring season from June through September.
What do you notice about the stream temperature at the McLay Road site? How is it different from the other sites? What we notice is there is a big difference between the temperature of the air and the stream. This trend suggests that, at this site, the creek is a gaining stream: it has a consistent groundwater source all summer.
Interestingly, the water temperature is slightly warmer here compared to other gaining streams. The very low flow and low volume of water might account for this difference.
Kelvin Creek
Let’s continue our journey on to Kelvin Creek. This is a long creek, so we will visit five sites along its journey from the source at Koksilah Ridge down to the Xwulqw’selu mainstem.

As the graphs below show, the creek appears to be a gaining stream where it meets the TransCanada Trail, Mountain Road Site 5, and Colpman Road. There are data points (dots) on the Colpman Road site through the end of July. No data points show up on the graph after that since the gaining stream went dry when the water table dropped below the surface and the groundwater source disconnected from the stream.
As we travel downstream to where the creek meets Koksilah Road, the creek appears to be a losing stream.

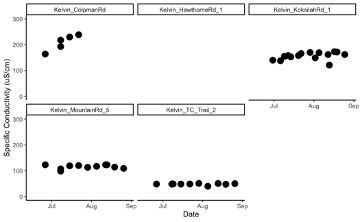
As we saw with the Glenora Road site along Glenora Creek, the Hawthorne Road site at Kelvin Creek does not have any stream temperature data points on its graph. There was no water at that site during the entire monitoring season from June through September.
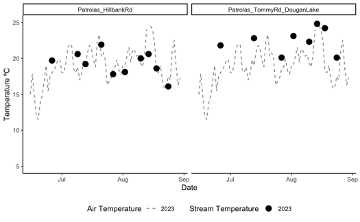
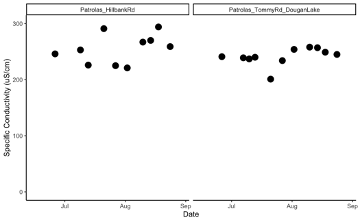
Patrolas Creek
The next stop on our journey is Dougan Lake. Water flows from the lake into Patrolas Creek. There is an artificially constructed dike (ditch) that connects the creek to the lake.

Dougan Lake is the main source of water for the creek, and further downstream the creek is most likely still a losing creek. The stream temperature are generally aligned with the air temperature. The temperature of the creek water is warm, like the lake, and the specific conductivity is generally aligned with the specific conductivity of the lake.
Norrie Creek
We visit with Norrie Creek at four sites: two sites along Mountain Road and one site each at Fleetwood Road and Koksilah Road.
The “Mountain Road 3” site was dry throughout the monitoring season. The stream temperature was consistent over time at the other three sites. This trend indicates that Norrie Creek is a gaining stream, though the source water is mixed.
Further downstream of these sites the stream is dry. However, it likely still provides water to the mainstem through the subsurface. Even tributaries that go dry at the surface can provide cool groundwater to the mainstem of the river.


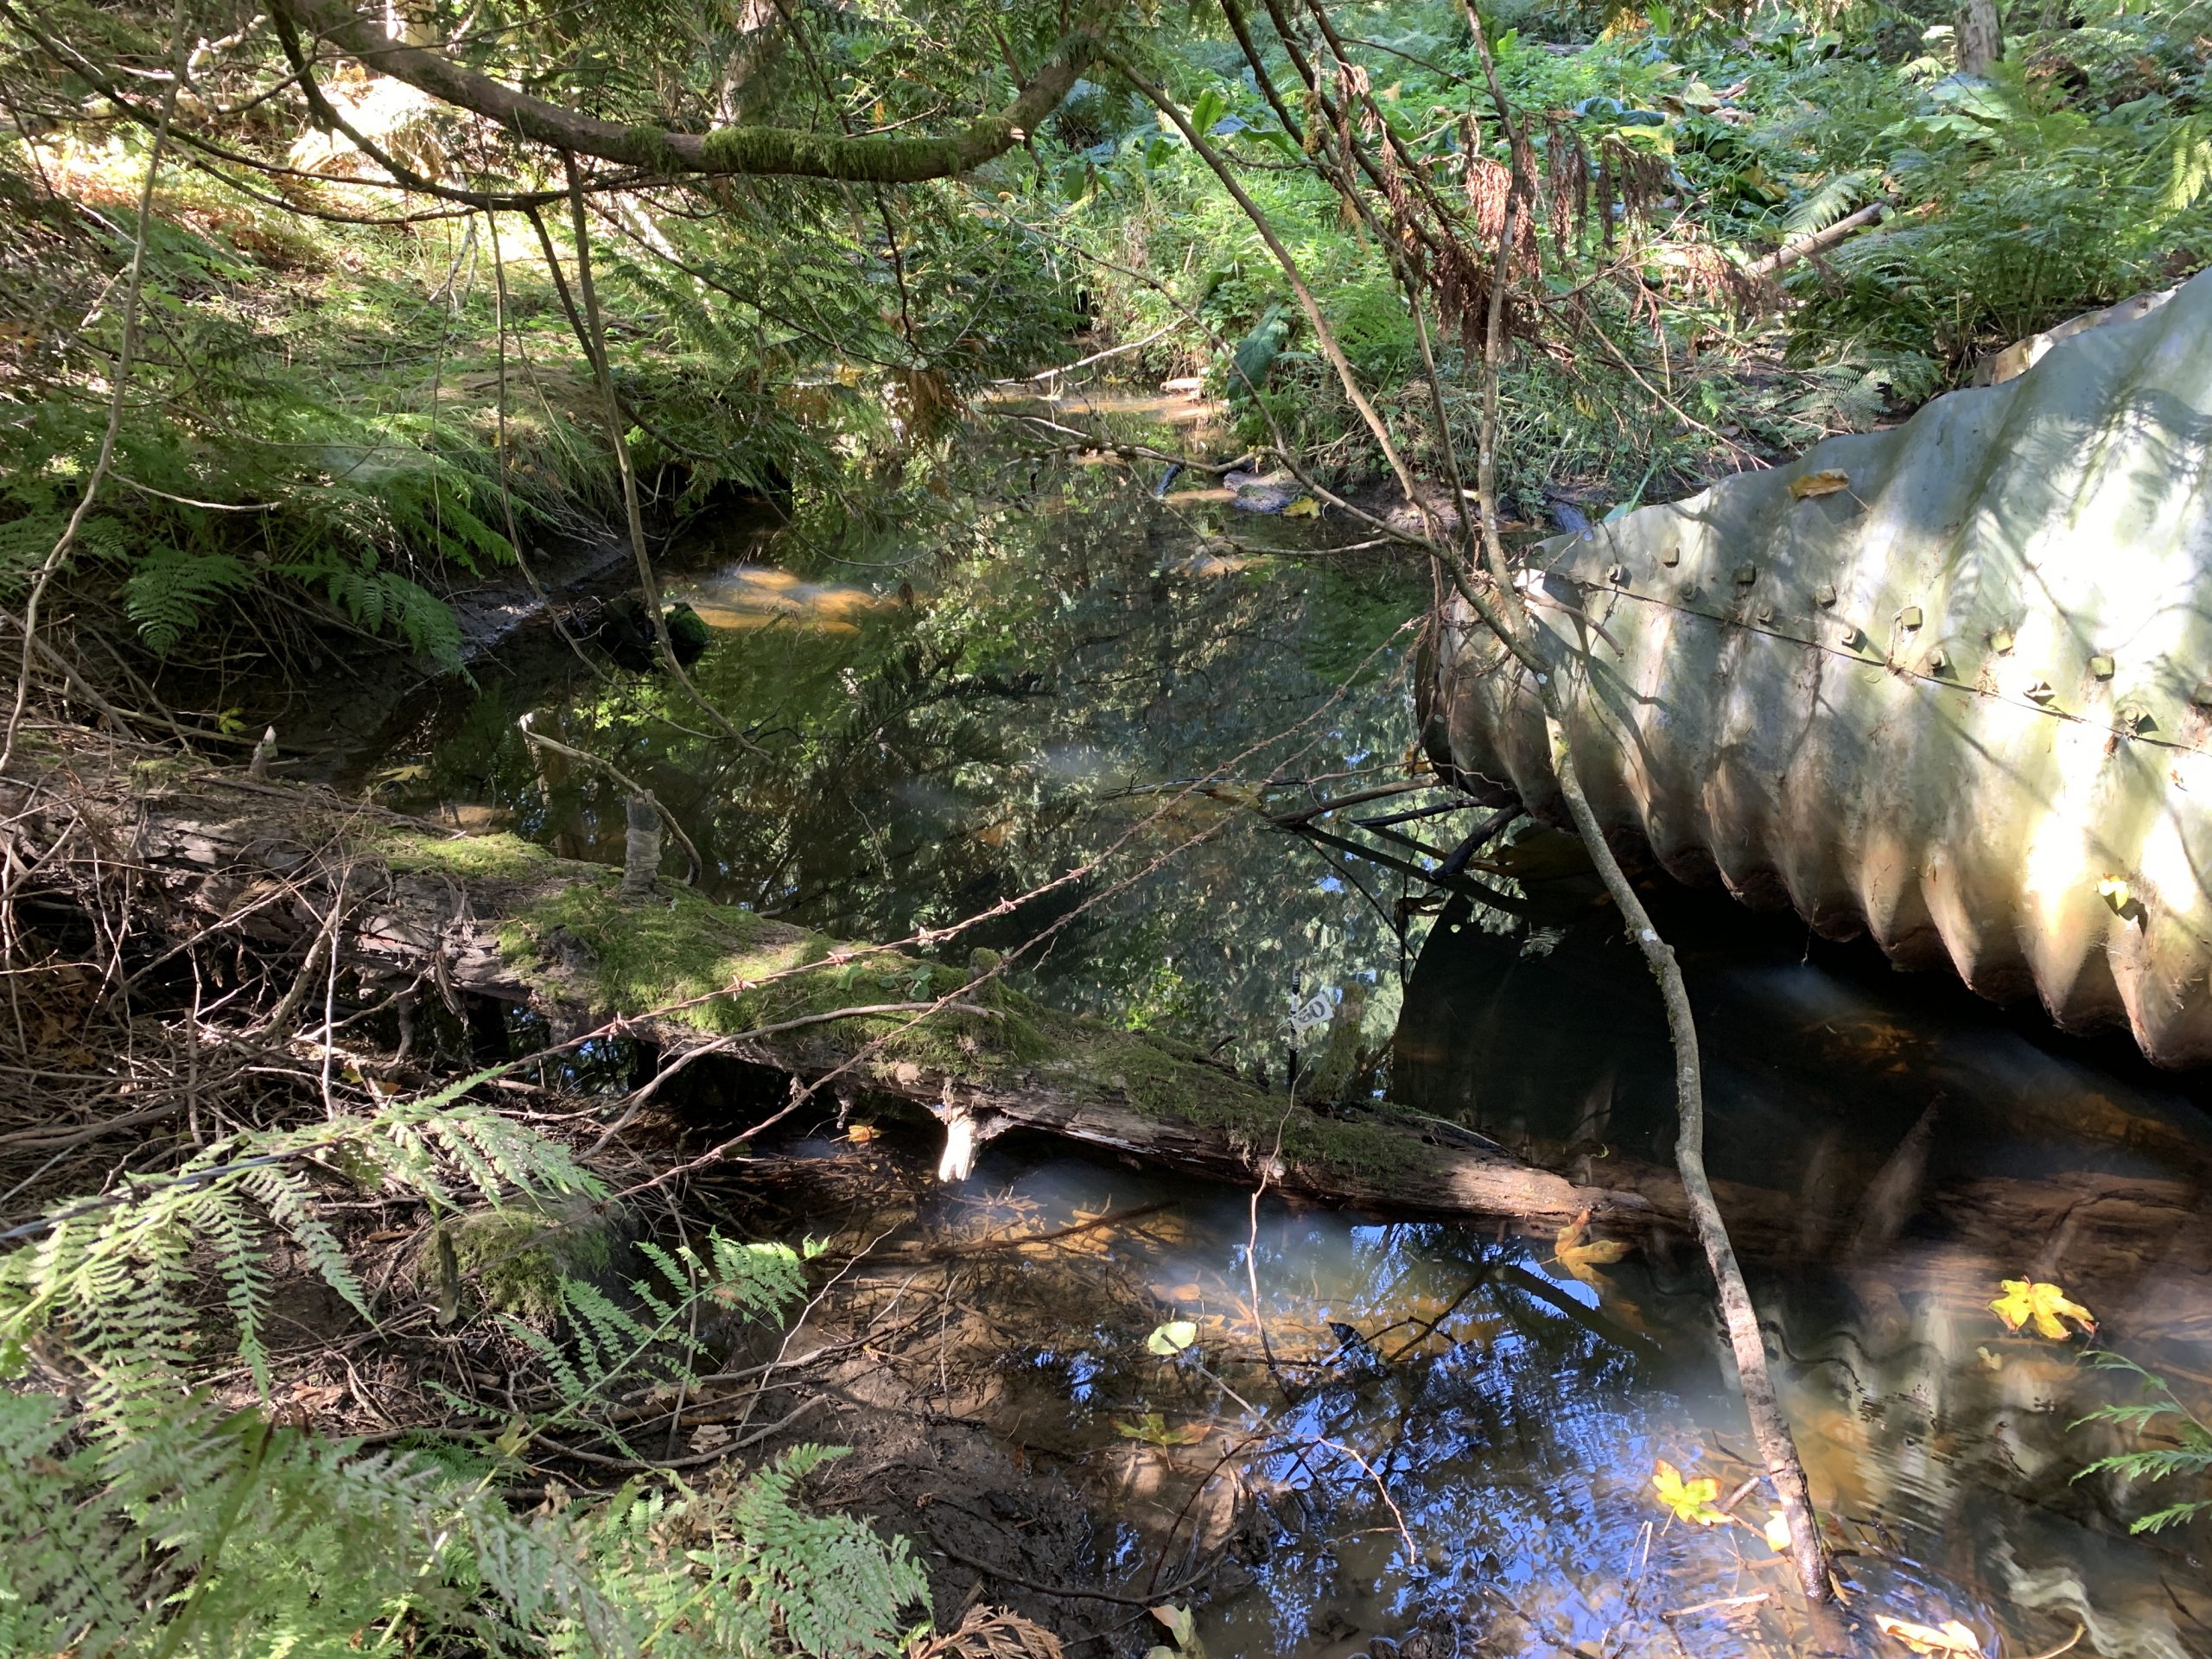
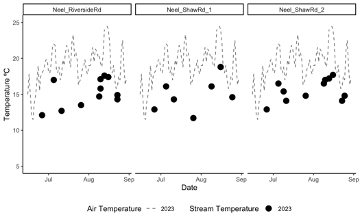
Neel Creek
We visit Neel Creek at three sites. The first site is by the mailboxes on Riverside Road. The creek appears to be a gaining groundwater dependent stream here. The next two sites are further downstream along Shaw Road. The creek is still likely to be a gaining stream along this stretch but has a mixed source introduced into the flow.

It appears that this creek is a good cool water refugia for fry (young fish) because fry were spotted in this small creek for most of the summer. The fry were about 4” long. This is the only creek in Xwulqw’selu where we consistently saw fry of this size. We saw smaller fry from time to time in other creeks and pools, but not regularly. Many of those fry disappeared when the pools they were in dried out.

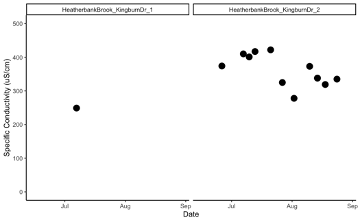
Heatherbank Brook
We stop at two sites along Kingburne Drive to visit with Heatherbank Brook. The brook is dry all summer at the first site so we continue to the “Kingburne Drive 2” site. Looking at the data here, the brook appears to be a losing stream with variable temperature and specific conductivity.

This area of the watershed has the highest recorded specific conductivity. It’s off the charts! In fact, we had to change the scale on this graph (from a maximum of 300 uS to a maximum of 500 uS) to see the data and the trend. The high specific conductivity may reflect some of the quarry activities upstream of the sites, or it may be due to other causes.

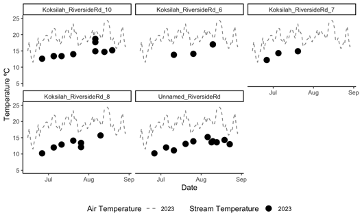
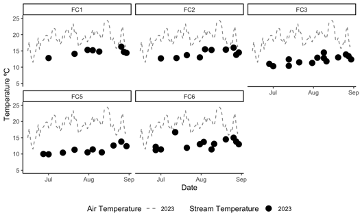
First Order Streams along Riverside Road
A first order stream is one that doesn’t have any branches or stream network. It follows a single path directly into the mainstem. First order streams are generally smaller; they are narrower, shorter, and have less flow than second order and third order streams.
The Xwulqw’selu watershed has many first order streams. It might not seem like there is much water in each one. However, these streams provide lots of water collectively to the mainstem of the river.

Let’s visit five first order streams as we drive along Riverside Road:
- The stream at Riverside Site 6 was dry during the entire field season. This stream, which flows at other times of the year, is dependent on rainwater to flow.
- Streams at Riverside sites 7 and 8 dried up partway through the season. These were gaining streams until the water table dropped below the surface and thus the streams ran out of groundwater to feed them.
- Streams at Riverside sites 10 and “unnamed” flowed all summer. They appear to be gaining streams and they have a reliable source of groundwater.

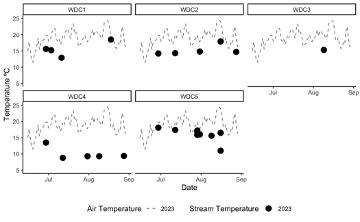
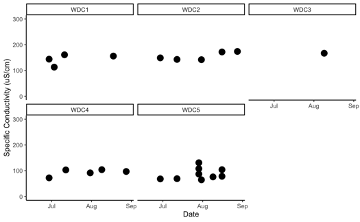
Wild Deer Creek & Fellows Creek
We visit five sites along Wild Deer Creek and six sites along Fellows Creek. The stream at Wild Deer Creek site 3 was dry throughout the field season.
Wild Deer Creek and Fellows Creek are examples that represent the majority of stream conditions present in the upper watershed. These are predominantly gaining streams. They are strongly dependent on groundwater to flow.

Did you enjoy the tour?
Here are a few other ways to connect with the watershed now:
- Continue to visit the watershed. Notice when water flows, how warm, cold, deep or shallow it is, and where water travels. Explore changes in the landscape, turn over rocks, watch wildlife, and wonder.
- Exchange water stories with neighbours and friends. What are you noticing in the watershed? What is similar and different about your experiences?
- Read short articles about groundwater-to-surface water connections in the Xwulqw’selu Sta’lo (Koksilah River watershed) at xwulqwselu.uvic.ca
- Sign up to monitor streamflow next summer. Email jshepherd@uvic.ca or call Jennifer at (236) 800-9011.
- Reflect and respond. Consider the effects you want your actions to have and work together with the biological workforce for water. Observe nature, preserve habitats, conserve water, plant seeds or seedlings, and grow plants for food or other functional purposes.
See you in the watershed!
References:
Recent Comments