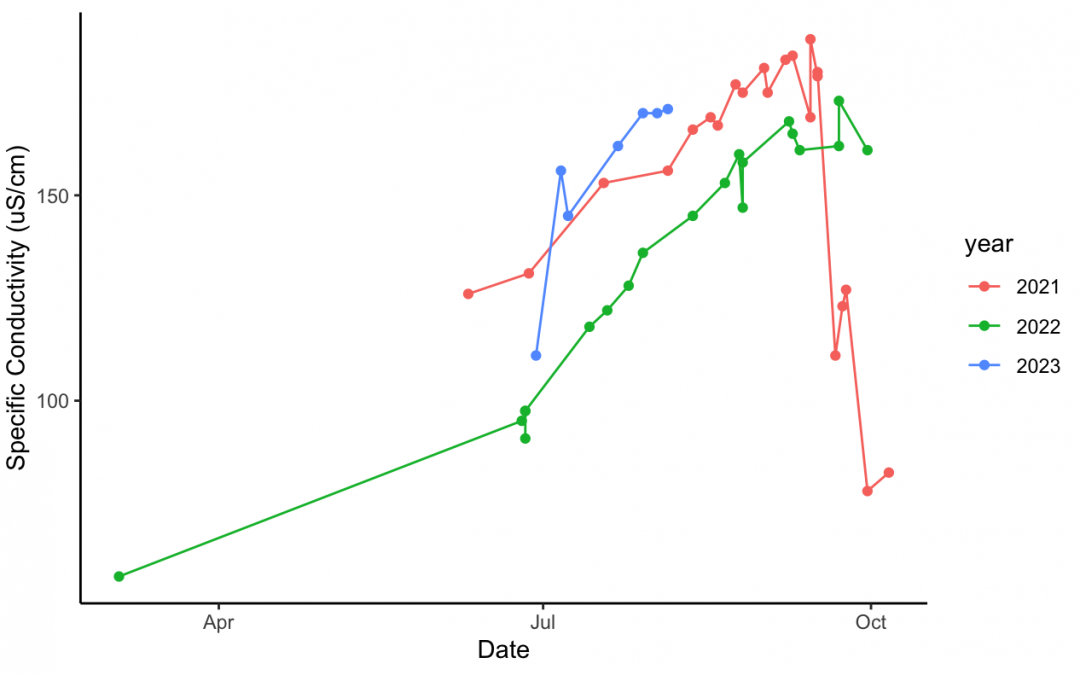
The Feature Photo is a line graph showing the specific conductivity of Xwulqw’selu Sta’lo’ at the Bright Angel Park streamflow monitoring site in the summer monitoring field season from 2021-2023
Can we rely on groundwater to keep the Xwulqw’selu Sta’lo flowing?
The answer is we are learning more and more about how changes in the flow of water in the river’s tributaries impact the flow of water in the river.
Our volunteer streamflow monitors continue to gather data about the specific conductivity and temperature of water in streams that flow into Xwulqw’selu Sta’lo’. Trends in the data help us understand:
- the relative amounts of water that come from the ground and from the surface at sites throughout the watershed, and
- how these relative amounts change over the summer.
Read on to learn how specific conductivity helps us understand the river’s reliance on groundwater through time.
Where does stream water come from?
Stream water has four sources:
- Snow melt (in spring)
- Rain (at any time of year)
- Soil (which holds and releases water travelling from the air, along the ground, and from the ground underneath)
- Underground aquifers
The relative amount that each source contributes to stream flow varies from place to place and throughout the year. When winter snow has finished melting, when the spring and summer rains have stopped, and when the soil has dried out, that leaves only one source of water to replenish a stream: groundwater.
Some people mistakenly think there is an endless supply of groundwater, and we don’t need to be concerned. They imagine a big tub of water that is so big that we can pump as much as we want to live or grow food and it will never run out. Sadly, that is not true.
Trends to watch
Thankfully, there are trends we can monitor to track the growing reliance of the Xwulqw’selu Sta’lo and its tributaries on groundwater through the summer. We can then explore the implications of these trends, adapt, and plan to respond to the trends in the future.
The data collected by our monitoring teams shows that the river’s reliance on groundwater is not the same across the watershed and different tributaries have different needs in the summer to be healthy and flowing.
One trend to watch is the change in specific conductivity of water over time. Another trend to watch is the change in water temperature in the Xwulqw’selu Sta’lo and its tributaries over time. We will explore that trend in a future post.
Trend to watch: Tributaries’ changing reliance on groundwater over the summer
How high specific conductivity gets and how quickly it increases through the summer tells us when a tributary is going to be relying solely on groundwater to flow.
Exercise 1: Compare specific conductivity along Glenora Creek over time
In Streamflow Snapshot 3, we learned what specific conductivity is and how it can help us to understand whether water in a stream is sourced more from surface water or groundwater at a particular place along the stream. We looked at a map of streamflow monitoring sites in the Xwulqw’selu watershed and applied what we learned to real data gathered by our Stream Teams.
Let’s look at the graphs on that map again. This time, let’s notice changes in specific conductivity from June to September in 2023 and from 2021-2023.
Click here to open a map of the monitoring sites prepared by PhD candidate Kristina Disney.
Note: This is a sneak peek! Kristina is continuing to refine the map and update the data in the graphs but the map is already useful for this exercise. Please be patient; it may take a moment for the page to load.
- Click on the blue markers at these four sites along Glenora Creek: Waters Road, Cavin Road, Marshall Road, and Doupe Road. Click on the + or – in the upper left-hand corner to zoom in or out on the map to help you find the sites along this creek.
- Notice the specific conductivity scale changes on the y-axis (the numbers on the black vertical line at the left) at each site. Also notice the months listed along the x-axis (the black horizontal line) for each site. Now notice the green, red, and blue lines on the graphs. These lines show data points from 2021, 2022, and 2023 respectively.
- Compare the lines in the graphs from these four sites along Glenora Creek. What can we notice?
From June through mid-August, the lines are generally trending upwards. The slope of the lines is also generally getting steeper and steeper over the summertime. These trends show that the specific conductivity of the water is rising higher and higher over the summer.
What does this mean? The increasingly upward trend suggests that more and more of the water at this place along Glenora Creek is coming from groundwater relative to other sources. The mineral concentration goes up because rainwater and shallow soil water have drained away and all that remains as a source of flowing water is deeper groundwater.
Sometime around late September or early October, the lines generally drop sharply downwards. Rainwater has very few minerals dissolved in it (almost zero!) When rainwater mixes with groundwater, the specific conductivity readings of the mixed water will be lower than water that is solely sourced from groundwater.
What might account for the differences in specific conductivity trends between 2021 and 2022?
Let’s consider weather events. In 2021, we experienced the heat dome and less rain fell than in 2022. In 2022, the temperatures were a bit cooler than in 2021, and there was more rain leading up to the summer.
There may also have been changes in the amount of water withdrawn from the creek or aquifer. However, we can’t reasonably consider this as a possible factor as we don’t have data about the volume of water pumped from creeks and wells here and elsewhere in the Glenora Creek sub-watershed.
Exercise 2: Explore Glenora Creek at the Glenora Road site
Take a look at the Glenora Road site. What do you notice here? What’s different from other sites along Glenora Creek?
Here are three interesting observations we can make about when the creek went dry here from 2021-2023:
- The red line, which shows data for 2021, is broken between about early June and mid-September. There are no data points for this period because Glenora Creek was completely dry here during this period.
- The green line, which shows data for 2022, only has three data points in June and July. The creek was flowing at this site until mid-July. It dried up and hadn’t yet begun to flow by the end of September when the monitoring season ended.
- Unlike other monitoring sites, there is no blue line here for 2023. This means that Glenora Creek has been completely dry at this particular site since the start of the streamflow monitoring season this year and it is still dry as of mid-August.
Exercise 3: Explore Glenora Creek at the McLay Road site
Take a look at the McLay Road site. The specific conductivity generally ranges from 200-250 uS/cm throughout the summer. The high number of mineral ions suggests the water in the stream at this place has been in contact fairly consistently with clays or limestone.
Interestingly, we don’t see the same kind of upward trend in the conductivity data over the summer as we do at the other sites along Glenora Creek. Given what you know about this place in the watershed, what do you think might explain the absence of that trend here?
What can we conclude?
The Xwulqw’selu Connections researchers and volunteer Stream Teams have only been gathering research data since 2021, and there isn’t any historical data to compare our results to.
However, with more and more data – literally at our fingertips – we can produce graphs like the ones on Kristina’s map and look for trends and patterns over time. This research will help us all anticipate when and where water may (and may not) be available in the watershed. Then we can make wise choices to adapt in the moment and plan to respond to changing forces in the future.
What can I do now?
- Choose a spot along the Xwulqw’selu Sta’lo’ that you can visit from week to week. Notice what changes about the flow of water here and life over time.
- Share this Streamflow Snapshot with your family, friends, neighbours and co-workers. Have a conversation about what you’re learning and tell us what else you want to know.
- Keep learning! Watch for future Streamflow Snapshots to be published on the Xwulqw’selu Connections website at https://oac.uvic.ca/xwulqwselu/
- Talk with a friend or neighbour and listen to those who may be struggling with the drought and water restrictions in their lives and livelihoods. Being there for one another with compassion and empathy through these tough times can make a real difference.
- Join a Stream Team to monitor the flow of water in Xwulqw’selu streams and creeks. Our teams of volunteers are active through the end of September. Contact Jennifer Shepherd at jshepherd@uvic.ca or call her at (236) 800-9011 to sign up or learn more.
Recent Comments