These questions may weigh heavily on your mind. From July through September, streamflow monitors are supporting researchers to answer questions like these as they visit over 30 sites at streams and creeks throughout the Xwulqw’selu watershed. The data they gather about the water’s specific conductivity and temperature help researchers – and us! – to understand connections between surface water and groundwater in the Xwulqw’selu watershed.
Why does this matter? We can anticipate where water will and won’t be available in the watershed throughout the summer by looking at the specific conductivity and temperature of stream water.
This Streamflow Snapshot explains specific conductivity and what it tells us about stream water. Future posts will explain what we can learn from looking at changes in specific conductivity at the same place over time and the role of water temperature.
Read on to learn how to tell when water in a stream is coming mostly from underground or on the surface, and why understanding that matters to us all.
Um, what is specific conductivity anyway?
Minerals from rocks can dissolve in water. When the atoms or molecules that make up minerals have an electric charge, they are called ions. The number of ions dissolved in water is determined by two things:
- the type of minerals (substrate) that the water flows over and through
- how much time the water spends in contact with minerals
Specific conductivity is a measure of total ions present in water. It is measured in microSiemens per centimeter (uS/cm).
How do we measure specific conductivity?
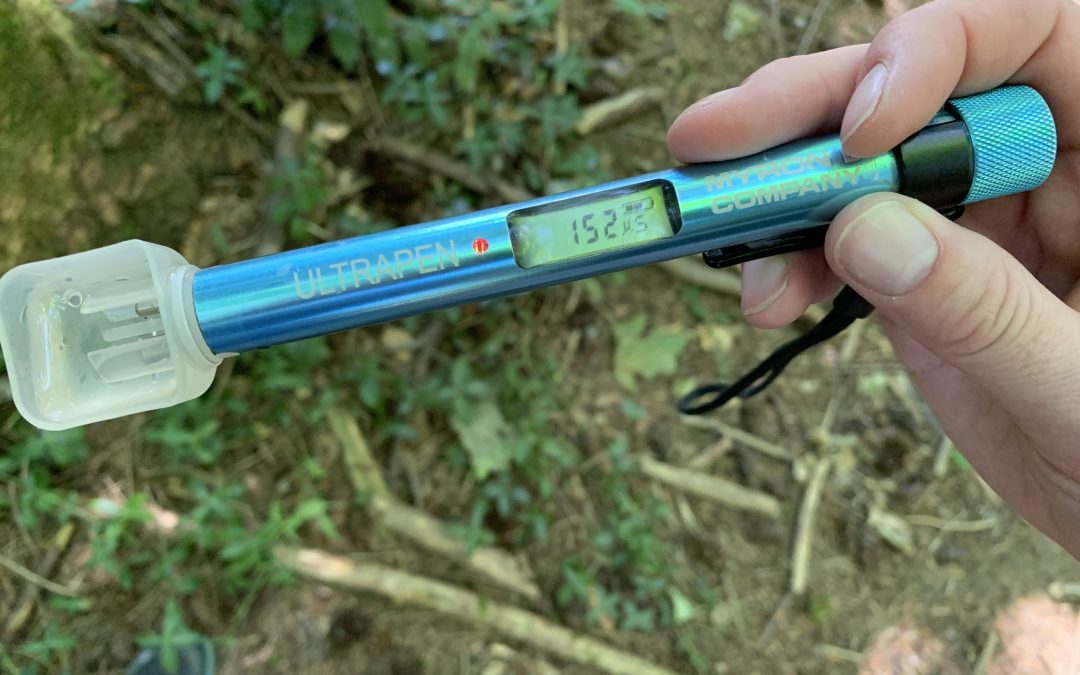
Streamflow monitors use a lightweight, battery-powered hand tool. It has a small scoop at the end with two electrical probes inside. A Stream Team volunteer takes a scoop of stream water and pushes a button. The tool counts the number of ions between the probes in the scoop and displays the result in seconds. It’s really easy and fun!
What does specific conductivity tell us about water in a stream?
Let’s follow a few raindrops through the watershed and imagine what might happen.
When water is in the sky, very few things get dissolved. So, when that water falls as rain (or snow), it has a conductivity that is close to zero (about 6-7 uS/cm).
Once the raindrops reach the earth, they begin a journey through the watershed. Some raindrops will travel into streams, creeks, and lakes as surface water, and others will pass through the soil and travel farther into the ground. The raindrops dissolve molecules of the materials that they meet along the way. Some of the dissolved molecules are organic but most of them are minerals.
In the watershed, water is mostly in contact with soil and rocks. Some minerals from the soil and rocks are more easily dissolved by flowing water than others.
Deep groundwater often has a conductivity that is 200 uS/cm or more. Water that has been stored underground for many years has likely been in contact with materials with ions, and those ions have had a lot of time to dissolve in the water.
While the specific conductivity reading on the Stream Teams’ tool doesn’t tell us which particular minerals are in the water, it does give us a useful hint. Look at the table below and notice the conductivity ranges.
| Approximate Conductivity Readings | |
| Rain | 6-7 uS/cm |
| Shallow soil water | 40 uS/cm or less |
| Crystalline bedrock | 40-80 uS/cm |
| Sand, gravel, and till | 120-180 uS/cm |
| Clays or limestone | 200 uS/cm or more |
How does specific conductivity help us know when and where our water source may run dry?
Now that we understand more about what specific conductivity is, here’s the punchline again:
We can anticipate where water will and won’t be available in the watershed throughout the summer by looking at the specific conductivity (and temperature) of stream water at sites throughout the watershed and over time.
Here’s how:
- Track where stream water has come from by measuring the conductivity of that water.
- Repeat these measurements at the same sites – week to week throughout the summer, and in summers yet to come.
- Take these measurements at many sites throughout the watershed.
- Look at the data to notice patterns in how and where surface water and ground water mix and move in relationship with each other in place and over time.
- Map the patterns in ways that people can understand them and begin to see the big picture together.
Want to know more? Read Streamflow Snapshot 4 to discover what you can learn from tracking changes in specific conductivity over time.
Now It’s Your Turn
Give this exercise a try to practice applying what we are learning together.
Exercise: Spot and compare differences in substrate (bedrock and other materials) in the watershed
Take a look at the conductivity readings taken at each of the streamflow monitoring sites. What kind of material do you think each of the streams in Xwulqw’selu watershed have primarily been moving through?
Click here to open a map of the monitoring sites prepared by PhD candidate Kristina Disney.
Note: This is a sneak peek! Kristina is continuing to refine the map and update the data in the graphs, but the map is already useful for this exercise. Please be patient; it may take a moment for the page to load.
- Choose a monitoring site to explore by clicking on a blue marker. Click on the + or – in the upper left-hand corner to zoom in or out on the map.
- Look at the scale on the y-axis (the numbers on the vertical line at the left). This is the specific conductivity scale at that site. Based on the range of the scale, and what you know of this place in the watershed, what kind of material do you think the stream has primarily been moving through to get here?
- Now choose a second site to explore. What differences do you notice in the scales on the graphs at different sites on a stream, and from stream to stream?
What can I do now?
- Go for a walk in the watershed and look around you. Look at the materials and life around and in the streambed.
- Share this Streamflow Snapshot with your family, friends, neighbours and co-workers. Have a conversation about what you’re learning and tell us what else you want to know.
- Keep learning! Watch for future Streamflow Snapshots to be published on the Xwulqw’selu Connections website at https://oac.uvic.ca/xwulqwselu/
- Talk with a friend or neighbour and listen to those who may be struggling with the drought and water restrictions in their lives and livelihoods. Being there for one another with compassion and empathy through these tough times can make a real difference.
- Join a Stream Team to monitor the flow of water in Xwulqw’selu streams and creeks. Our teams of volunteers are active through the end of September. Contact Jennifer Shepherd at jshepherd@uvic.ca or call her at (236) 800-9011 to sign up or learn more.
Recent Comments