Wow what a great field season. We are cataloging where streamflow is coming from in the watershed by measuring and observing tributaries before they reach the mainstem of the Xwulqw’selu Sta’lo’. This is our second year of monitoring the lower watershed, and it’s important to remember that streamflows were generally higher this year because of the cold, wet early summer. The volunteers primarily focused on the lower watershed while Kristina invested heavily in monitoring all the major tributaries throughout the season. She was strongly supported by Mosaic with field help and vehicles. If you would like to see images of these observations please check out our outcomes page.
We wanted to share our preliminary observations, but these might change as we look at the data in more detail over the winter. Our key watershed observations so far are:
- The upper watershed contributes 80-90% of streamflow of Xwulqw’selu Sta’lo’ in the dry summer season. The relative contribution of some tributaries to the total streamflow varies throughout the summer.
- Specific tributaries contribute more to the streamflow of the Xwulqw’selu Sta’lo’ than expected based on their drainage area including WildDeer, West Koksilah and Patrolas Creeks (as well as some unnamed tributaries).
- Over 700 observations were gathered by 25 active volunteers, helping develop a better understanding of various tributaries. By August of 2022 nearly all streams had similar conductivity and temperature values as 2021 even though we had a longer, wetter spring. Over the winter, we will share more of this understanding with the monitoring volunteers, partners and rights holders once the data are analyzed.
- The upper watershed is mostly bedrock aquifers whereas the lower watershed is mostly sand and gravel aquifers. These different aquifer types have distinct conductivity and temperature signatures. Bedrock aquifers being lower conductivity and more consistent and colder temperatures.
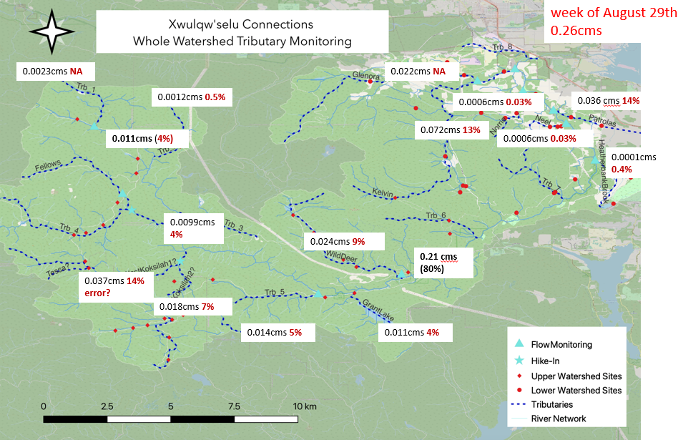
Some of these observations can be seen in the map below of the Xwulqw’selu watershed (brighter green) showing the locations where streamflow was monitored in the Lower Watershed (red dots) and Upper Watershed (red squares). The bright blue triangles and stars are where Kristina measured the streamflow of the tributaries throughout the summer. This map is from the week of August 29 when the streamflow of the Xwulqw’selu was 0.26 cms (cubic meters per second) measured by the government gauge (and shown in red text in the top right). Each of the white rectangles shows the measured streamflow in a tributary in cms (cubic meters per second) and in red text as a percentage of the streamflow measured by the government gauge.
We look forward to learning more from all the great data collected during the field season, and to working together again next summer. Enjoy the rains this winter!
Recent Comments