ONLINE EXPERIMENTATION
Many experimenters have been forced to move their research online due to restrictions on in-lab research. We have chosen to take this oppourtunity to deeply explore web-based experimentation and transform how we collect our data. Beyond learning existing tools, we have also been working to develop new tools for remote experimentation that extend beyond typical behavioural data.
Behavioural
All of our lab members program their own experiments using the popular framework jsPsych. This tool allows for quick scaffolding of projects, and easy access to typical measures such as response time and accuracy. Using the hosting site Pavlovia, we are able to collect data from dozens of participants in very little time, allowing us to focus on data analysis and experimental design.
Psiz
As of late, much of our research has employed PsiZ, an open-source Python modelling software developed by Dr. Brett Roads. In the lab, we often are interested in examining how one’s experience in particular visual domains may influence the way in which they perceive items belonging to that domain. To this end, we employ PsiZ to infer psychological embeddings. These embeddings allow us to visualize participants’ perceived groupings of items in a domain (i.e., perceived categorical structure). For instance, a recent study of ours examined the difference in how a novice versus an expert birder perceives different species of warbler birds.
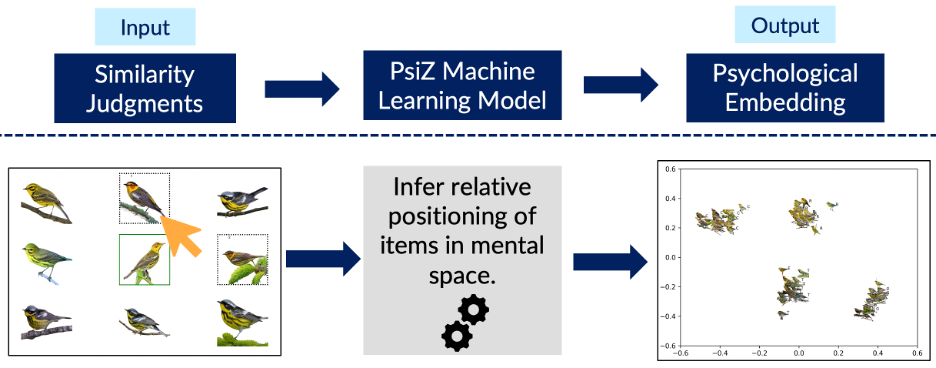
To collect data for PsiZ experiments, we have participants rate the similarity of images presented on screen. These similarity judgments are then used to train a model. Following training, the model outputs a 2-dimensional similarity space where objects are clustered according to their level of perceived similarity. Click here to learn more about PsiZ!
web-based eye-tracking : gazer

 The Gazer project combines jsPsych, a widely used framework for online experiments, with Webgazer.js, an open-source software that acesses a laptop’s camera feed to provide real-time prediction of gaze location on the screen. The result is a collection of jsPsych modules that will allow easy plug-and-play eye-tracking experimentation. The Gazer method also includes validated methods for data validation, and analysis. The goal is to release the Gazer code as an open-source project so that other vision scientists can use it to easily conduct web-based eye-tracking. For more information, please see Amy vanWell.
IN-PERSON EXPERIMENTATION
BEHAVIOURAL

The most basic behavioural measure we record from participants are their accuracy and response time in an experiment. The response time refers to the interval of time between the presentation of a stimulus to a subject and the beginning of the subject’s response to that stimulus. In the Different Minds Lab, we use the following devices to measure accuracy and response time. For most of our experiments, we collect response time using mouse or keyboard input.
EYE TRACKING
![]()
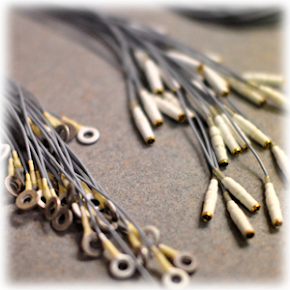
An eye tracker tracks the movement of your eyes. Using eye tracking technology, we will know where you are looking at when you are looking at the picture of a face, a bird, or watching a movie. In the Different Minds Lab, we use the EyeLink 1000 remote system by SR Research. The eye tracking camera (the picture at lower left) records the eye movement at the resolution of 1000 times per second based on the reflections of infrared from your pupils that projected by the illuminator next to the eye tracker camera. One of the advantages of remote/head-free system is that it allows reasonable head-movements. You can put a target sticker on the forehead and the eye tracker will correct the eye movement data according to your head movement in real time. This is especially helpful when you test children.
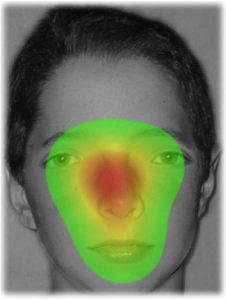
The data collected by the eye-tracker is very rich, and can be analyzed in a lot of different ways. For example, you can look at the number and the size of the saccades that are made during the presentation of the stimuli. The most direct way to make use of the eye tracking data is to visualize the eye movements in terms of heat maps. On a heat map, hotter colour refers to longer time spent in fixating at that location. Eye tracking heat maps are very useful to study high level visual processing. For example, systematic differences were presented in the processing of upright and inverted faces.

ELECTROENCEPHALOGRAPHY
Electroencephalography (EEG) is the recording of electrical activity along the scalp. EEG measures voltage fluctuations at various locations on the scalp resulting from current flows within the neurons of the brain. In the Different Minds Lab, we use a 64-channel QuickAmp Brain Vision system to collect EEG data. The advantage of EEG is its high temporal resolution. In our current system, the temporal resolution can be as high as 1000Hz, meaning that we can collect data every 1/1000 of a second. However, the disadvantage of EEG is its poor spatial resolution. It is mathematically impossible to find the exact source of the brain activity based on scalp-level EEG. However, combined with previous knowledge of the source of the brain activity related to the task being performed, and the various source localization methods, we can at least have a good estimate of the source of the signal.

We examine both event-related potentials (ERP) and the steady-state visually-evoked potentials (SSVEP). ERPs elicited by a specific event in one of the sensory channels (e.g., visual, auditory) provides information of how strong (amplitude) and fast (latency) a certain brain response is, and can be averaged across a lot of trials and then compared across different conditions (e.g., the visual presentation of an upright vs. an inverted face) in terms of the amplitude and latency of the peaks. By contrast, SSVEPs are evoked by periodic visual stimulation. For example, if you are watching the presentation of faces at 6Hz (6 faces per second), neural responses will be entrained into 6Hz and its harmonics (i.e, 12 Hz, 18Hz, 24Hz, etc.). We investigate the strength of the frequency component in the brain wave corresponding to the stimulation frequency across different conditions. For example, if the power of the 6 Hz component in the brain wave is stronger when you are looking at upright faces flickering at 6 Hz, then when you are looking at inverted faces flickering at 6 Hz.