
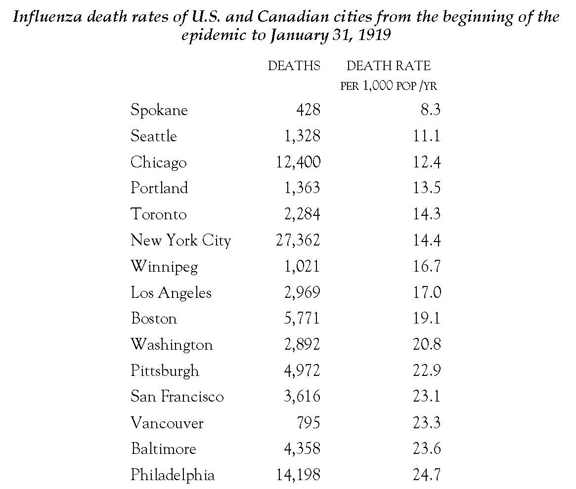
The following chart shows the death rate from Spanish Influenza in Vancouver at 23.3 per 1,000 per annum. That’s ten times higher than Victoria’s 2.3 per 1000 for 1918-19. (See How Victoria fared.)
 Sources [amplified]: Calculations were based on figures from: Alfred W. Crosby, Jr., Epidemic and Peace, 1918 (Westport, Conn.: Greenwood Press, 1976), pp. 60-61. Ontario, Thirty-Eighth Annual Report of the Provincial Board of Health of Ontario, Canada for the Year 1919 (Toronto: Printer to the King, 1920), p. 236. City of Winnipeg, op. cit., p. 10. The Vancouver Daily Province, 17 February 1919, p. 7. City of Vancouver, Annual Report for Year Ending December 31, 1918, p. 73.
Adapted from Table 1 of Margaret W. Andrews, “Epidemic and Public Health: Influenza in Vancouver, 1918-1919.” BC Studies, No. 34, Summer 1977, pp. 21-44.
Death figures gathered for the four-and-a-half month term under study — for many cities far the worst time in the life of the pandemic — were converted to a rate per annum, but how is not made clear in the text.
A much lower death rate was derived for Vancouver in the M.Sc. thesis of Sarah Buchanan, Spanish Influenza in the City of Vancouver, British Columbia, 1918-1919 (UVic Geography department, 2012). Using available population numbers and a total of 934 deaths from influenza — but not pneumonia — reported in the City of Vancouver in 1918-19, “the mortality rate from influenza for the total population of Vancouver was 8.3 per 1,000 for 1918-19” (pp 49-50).