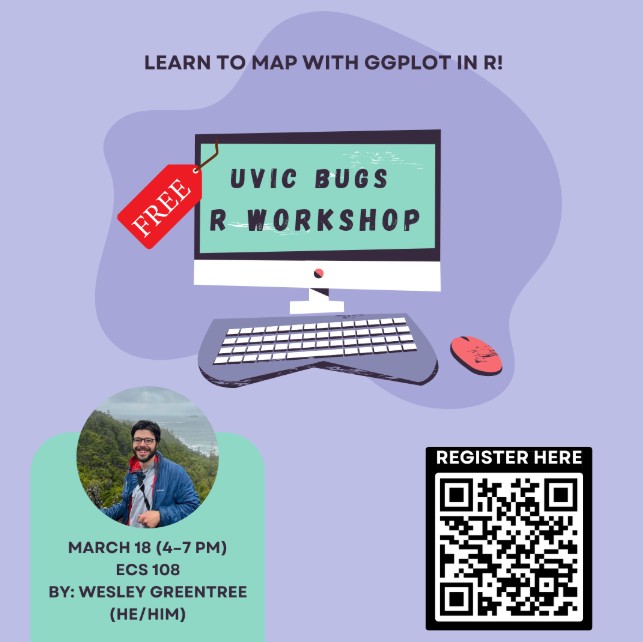
Free workshop through the UVic Biology Undergraduate Society on using R to visualize and analyze spatial data.
Tuesday 18 March 4-7 pm. We have set aside seats for grad students/research technicians.
You will learn about R and its data visualization capabilities with the ggplot2 package, then move into how we can use R’s spatial data packages to create beautiful maps of our study areas (as well as interactive and animated maps).
Even if you don’t need to make maps for your research, the workshop includes some handy ggplot tricks and tips.
New content and a fun opportunity to build R skills.
For a sneak peak, you can check out a past workshop for the Canadian Society for Ecology and Evolution here: https://github.com/wesleygreentree/CSEE2024-R-maps