Publications
Palmer-Wilson, K., Banks, J., Walsh, W., Robertson, B., Sedimentary Basin Geothermal Favourability Mapping and Power Generation Assessments. Renewable Energy (127). 2018
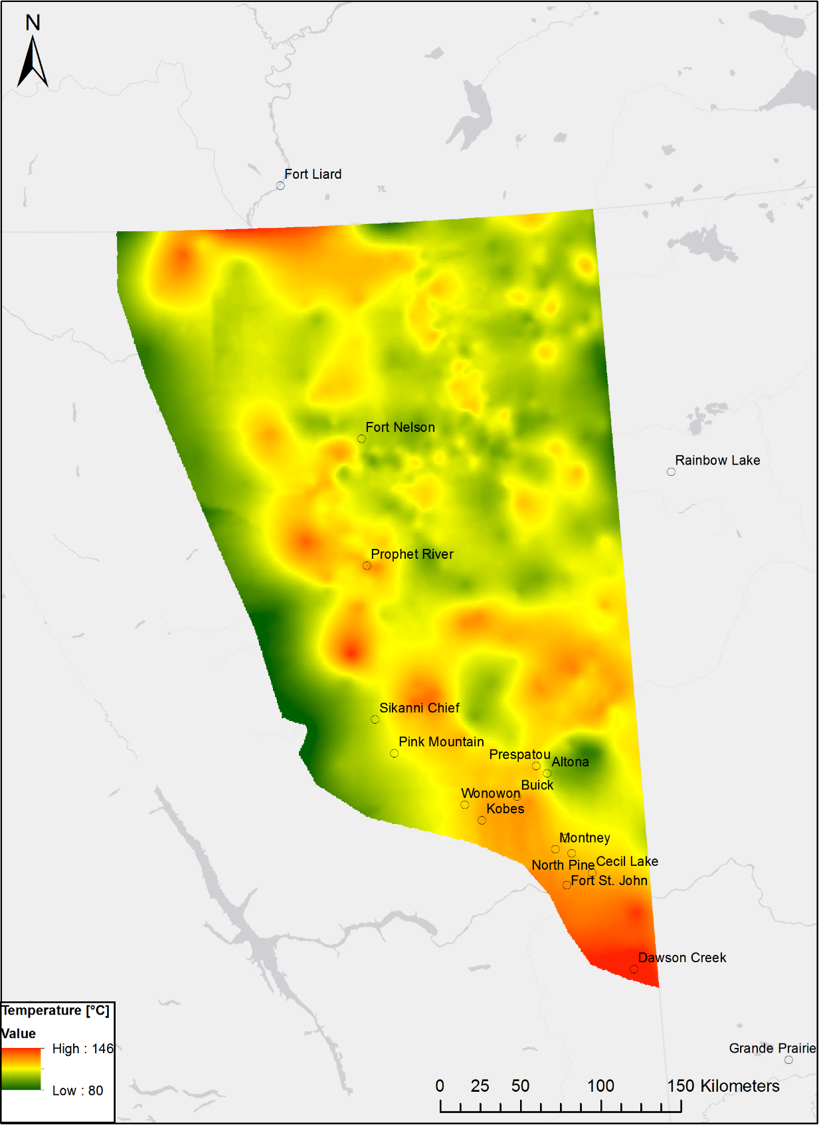 Globally, sedimentary basin geothermal energy could prove a significant source of low-carbon electricity, but regional resource assessments require collecting high cost sub-surface data. This study applies freely available petroleum production data in a comprehensive approach to: 1) identify favourable locations for geothermal energy development and 2) to estimate electric power generation potential at those locations. A geothermal favourability map identifies favourable locations by overlaying geological and economic criteria. Power generation estimates are based on the Volume Method, which derives power capacity from the thermal energy present in a reservoir. As a method case study, the northeastern British Columbia section of the Western Canada Sedimentary basin is analyzed. Here, four favourable areas are identified (Horn River, Clarke Lake, Prophet River and Jedney) and have a total power capacity of 107.3 MW (distribution mode). Values normalized by reservoir volume range from 1.8 – 4.1 MW/km3. Geothermal brine flow rates required to produce 1 MW of electric power range from 27.5 – 60.4 kg/s. Reservoir size is derived from stratigraphic cross sections and natural gas pool outlines. Uncertainty in reservoir parameters are modeled using Monte Carlo simulations.
Keller, V., Lyseng, B., English, J., Niet, T., Palmer-Wilson, K., Moazzen, I., Robertson, B., Wild, P., Rowe, A., Coal-to-biomass retrofit in Alberta –value of forest residue bioenergy in the electricity system. Renewable Energy, Mar. 2018
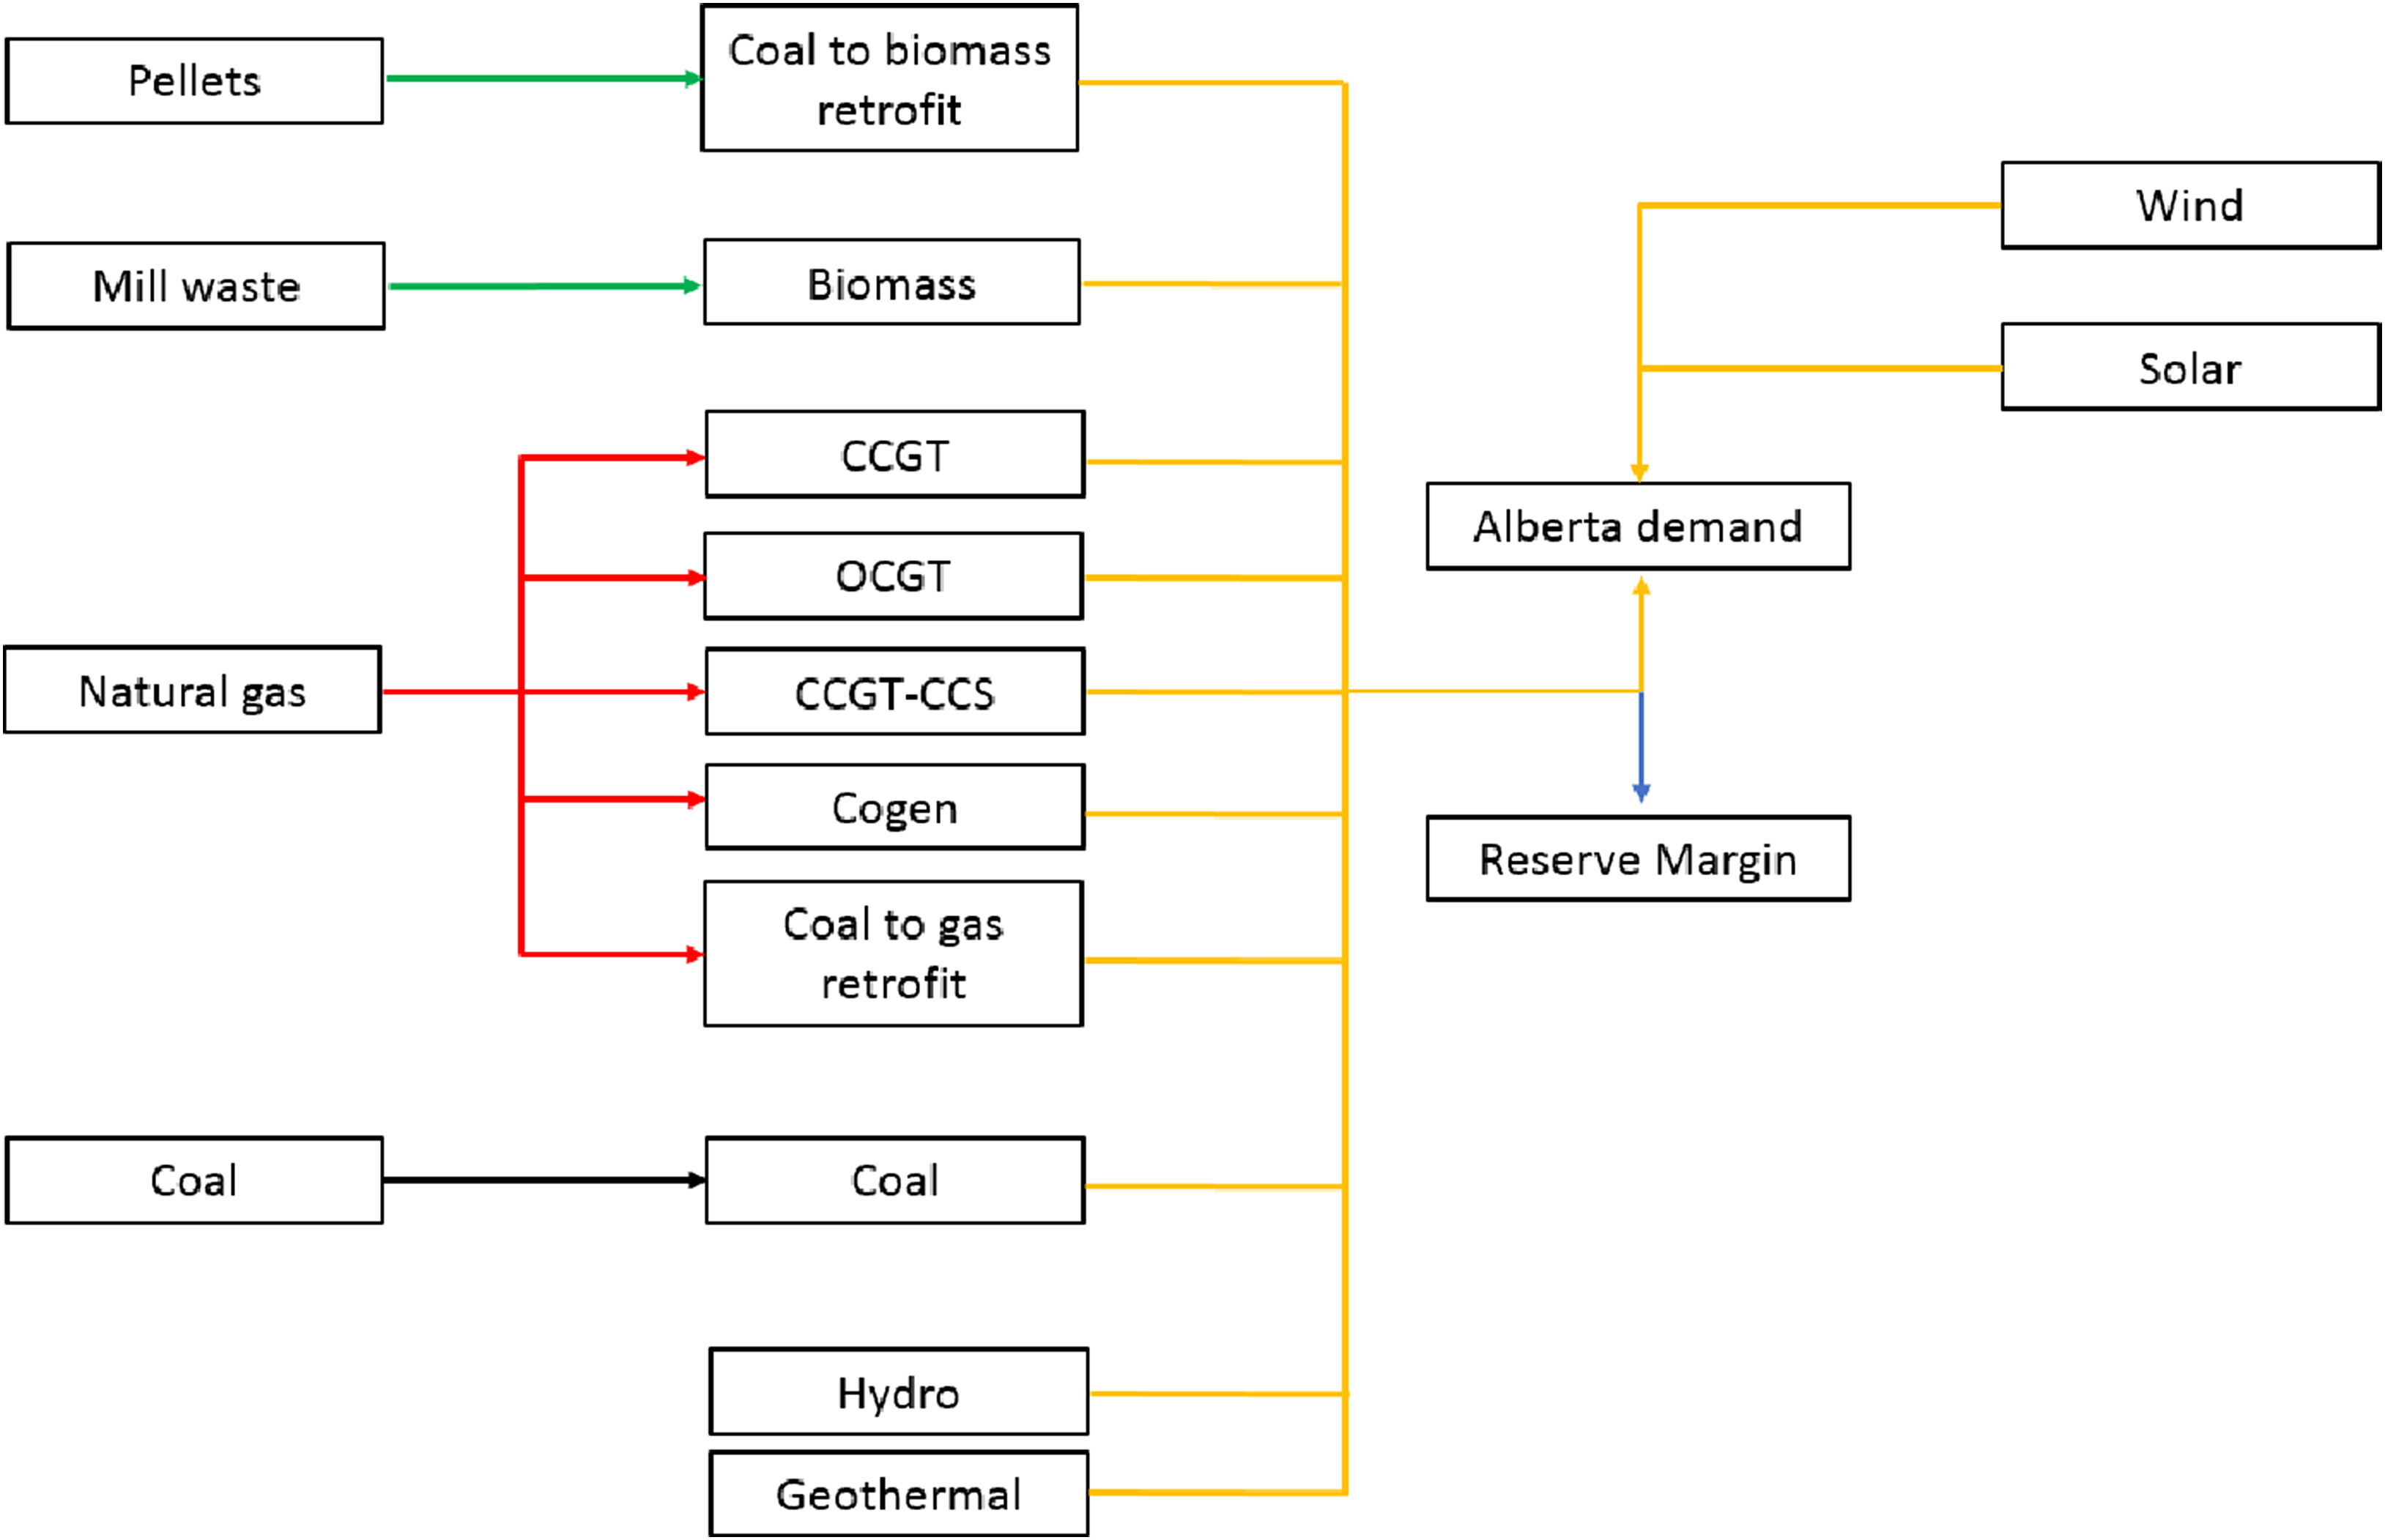 The use of forest residue may mitigate greenhouse gas emissions by displacing the use of coal or other fossil fuels for electricity generation. However, economic viability of bioenergy requires availability of feedstock at appropriate cost. The current work attempts to quantify delivered biomass cost at plant gate and estimate cost and emission benefits to the electricity system associated with the conversion of coal units to bioenergy. This study is carried out with the optimization model OSeMOSYS, analyzing the Alberta electrical system, its mid-term coal phase-out and renewable energy targets. Alternative scenarios were compared to evaluate the effect of a biomass retrofit option on the incentives needed to achieve 30% renewable penetration by 2030. Results show that although bioenergy has a higher levelized cost than wind power, the system requires less backup capacity and less renewable energy credits to meet renewable energy goals when the biomass retrofit is allowed. In addition, the total system cost to 2060 is found to be 5% less than the scenario without the biomass option. The firm capacity provided by biomass compensates for its higher levelized cost of energy.
Lyseng, B., Niet, T., English, J., Keller, V., Palmer-Wilson, K., Robertson, B., Rowe, A., Wild, P., System-level power-to-gas energy storage for high penetrations of variable renewables. International Journal of Hydrogen Energy , Feb. 2018
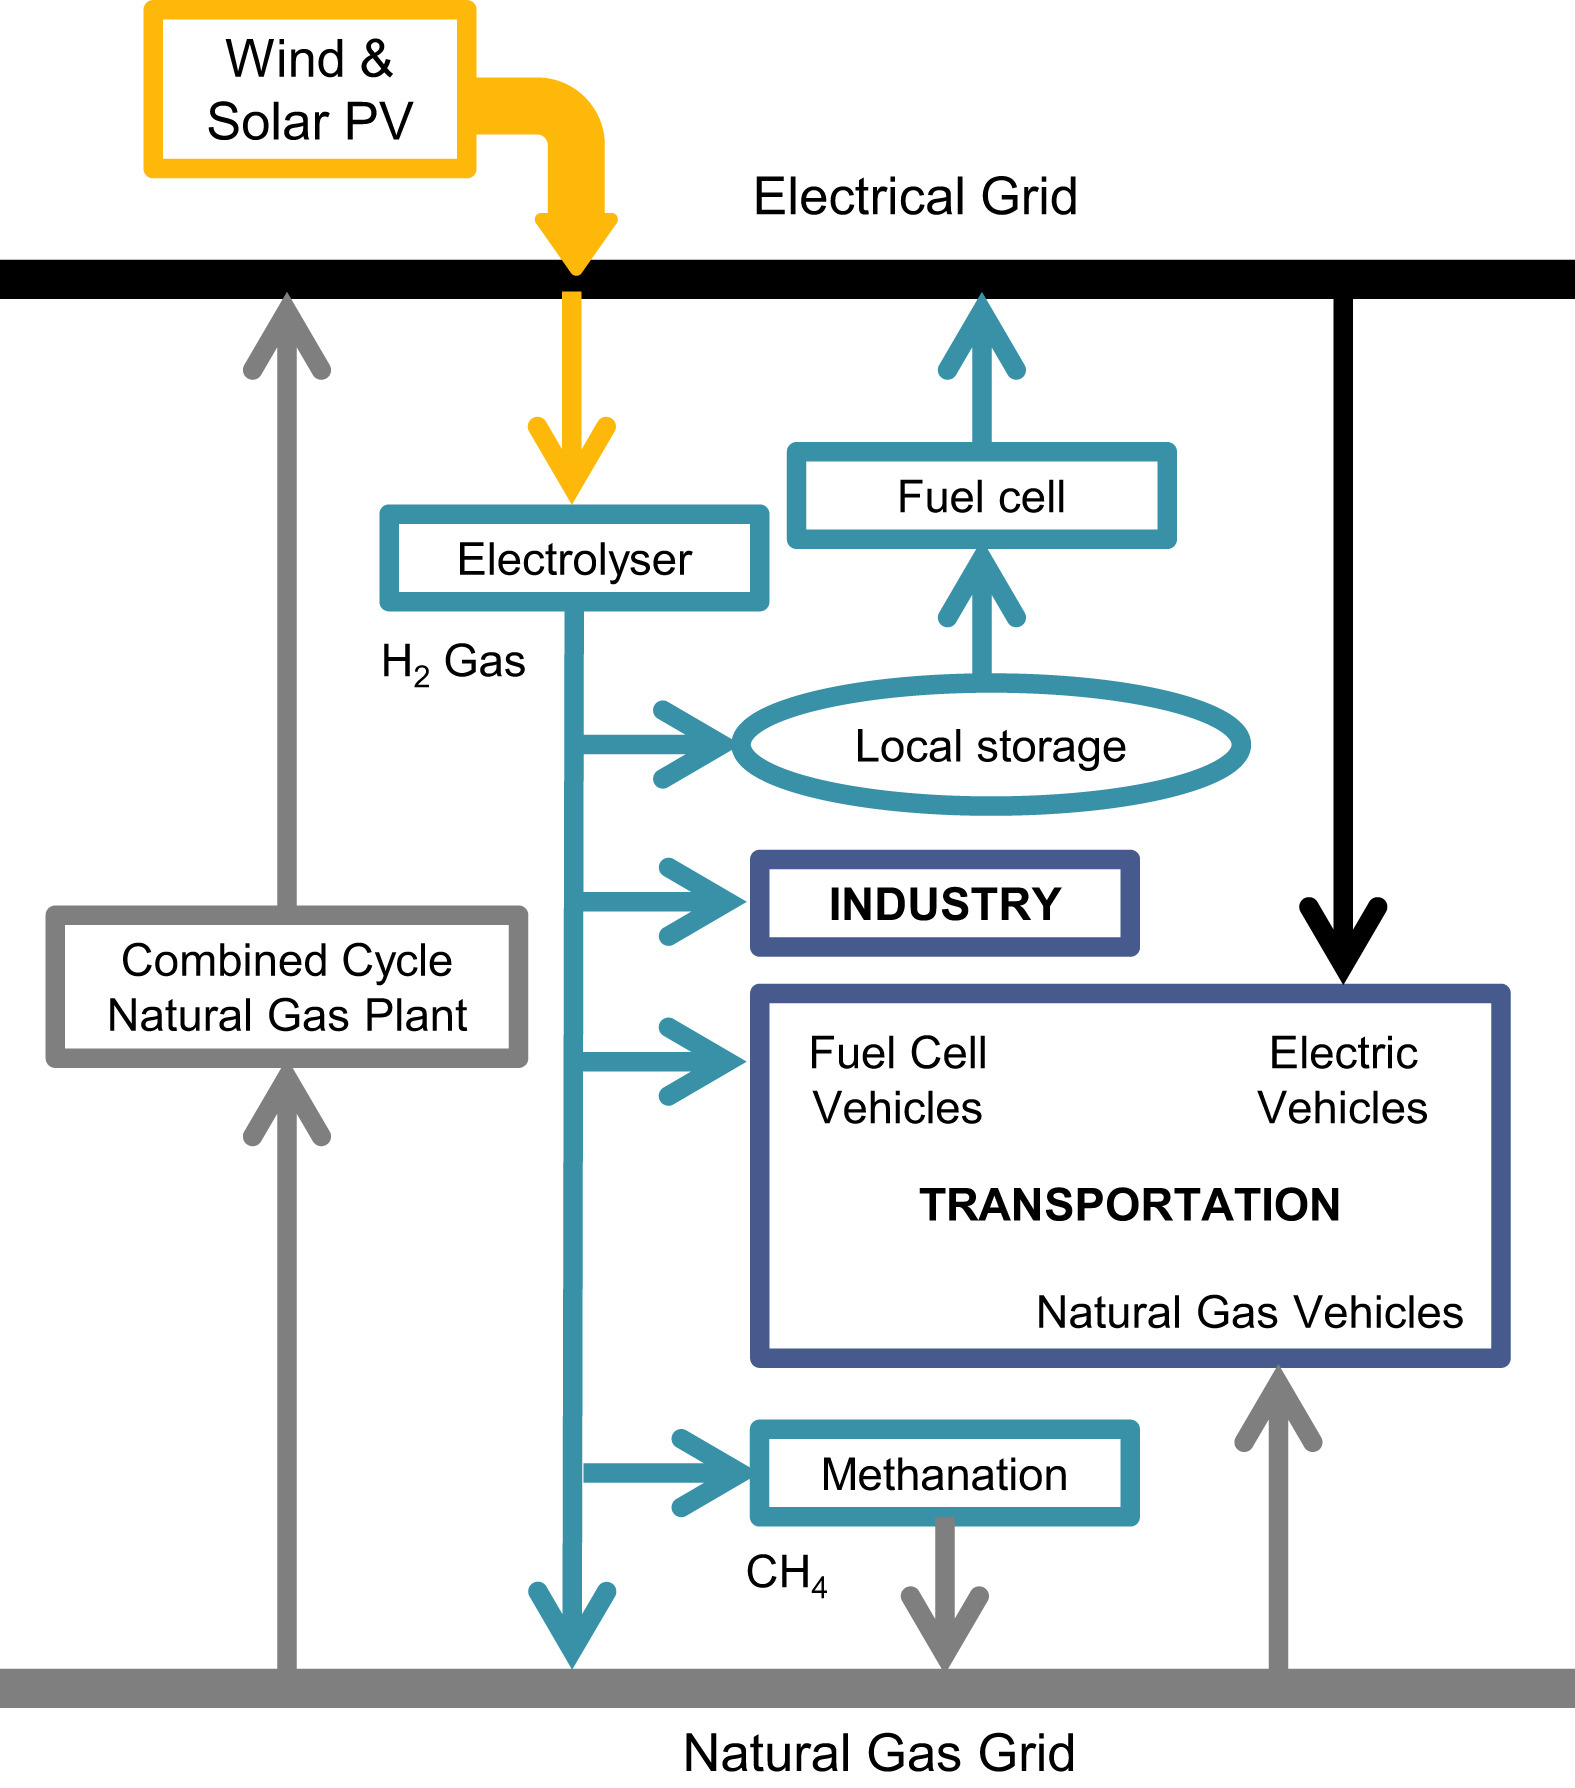 According to outlooks by the IEA and the U.S. EIA, renewables will become the largest
source of electricity by 2050 if global temperature rise is to be limited to 2°C. However, at penetrations greater than 30%, curtailment of wind and solar can be significant in even the most flexible systems. Energy storage can reduce curtailment and increase utilisation of variable renewables. Power-to-gas is a form of long-term storage based on electrolytic production of hydrogen. This research models the co-sizing of wind and solar PV capacity and electrolyser capacity in a jurisdiction targeting 80% penetration of variable renewable electricity. Results indicate that power-to-gas can reduce required wind and solar capacity by as much as 23% and curtailment by as much as 87%. While the majority of charging events last less than 12 h, the majority of the total annual stored energy comes from longer-term events. Additional scenarios reveal that geographic diversity of wind farms reduces capacity requirements, but the same benefit is not found for distributing solar PV.
English, J., Niet, T., Lyseng, B., Palmer-Wilson, K., Keller, V., Moazzen, I., Pitt, L., Wild, P., Rowe, A., Impact of electrical intertie capacity on carbon policy effectiveness. Energy Policy , Feb. 2017
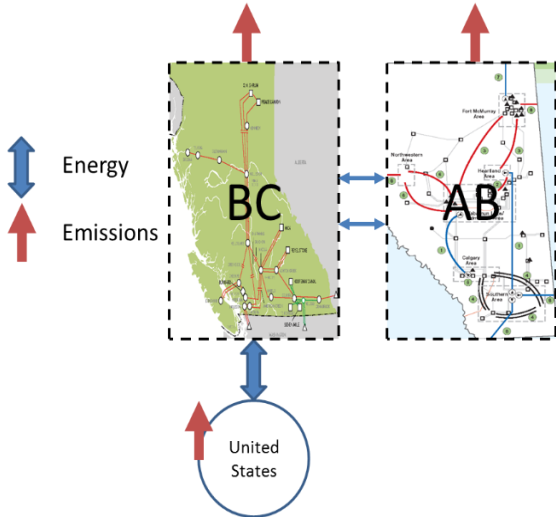 This study investigates the potential cost and emissions reductions that result from an increase in electricity transmission capacity between Canada’s two westernmost provinces: Alberta, a fossil fuel dominated jurisdiction, and British Columbia, a predominantly hydroelectric jurisdiction. A bottom-up model is used to find the least cost electricity generation mix in Alberta and British Columbia under different carbon policies. The long-term evolution of the electricity system is determined by minimizing net present cost of electricity generation for the time span of 2010–2060. Different levels of intertie capacity expansion are considered together with a variety of carbon tax and carbon cap scenarios. Results indicate that increased intertie capacity
reduces the cost of electricity and emissions under carbon pricing policies. However, the expandable intertie does not encourage greater adoption of variable renewable generation. Instead, it is used to move low-cost energy from the United States to Alberta. The optimal intertie capacity and cost reduction of increased interconnectivity increases with more restrictive carbon policies.
Keller, V., Robertson, B., Wild, P., Rowe, A. (2017). Using biomass at shuttered coal-fired plants could help provinces meet their climate targets for a lower cost. Policy Options, Feb. 2017
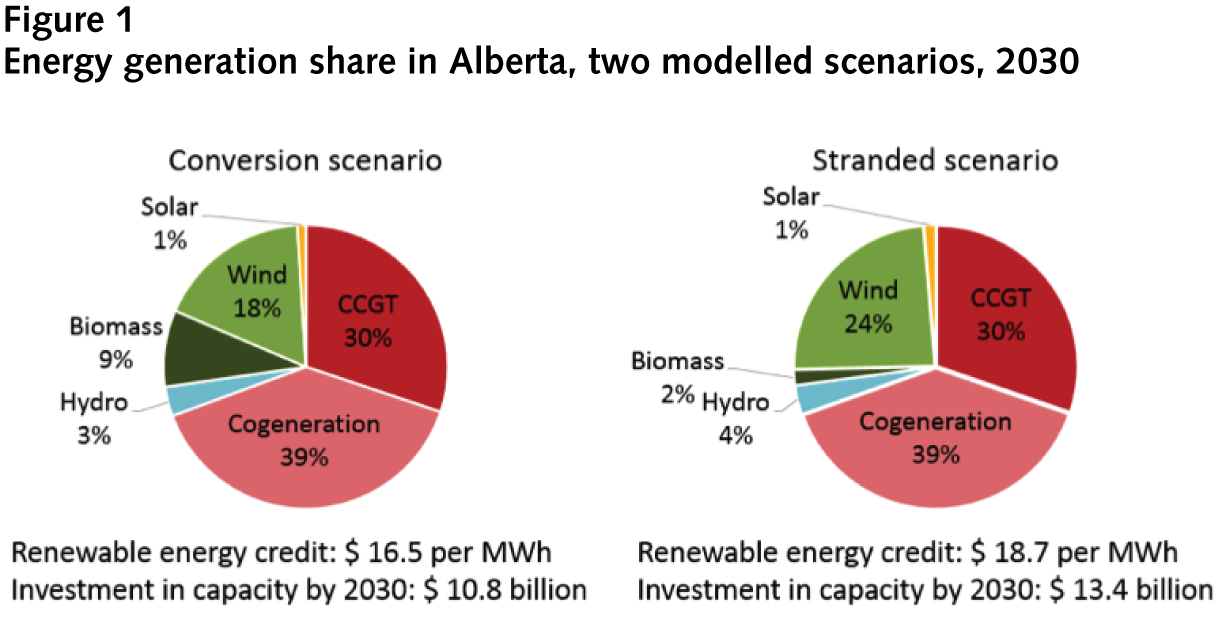
Alberta’s provincial government has set goals to phase out coal electricity generation by 2030. While the carbon intensity of the power sector is to significantly decrease as a result, a number of coal units are to become stranded by the same date. According to this new regulations, over 2.4 GW of coal capacity will face earlier than expected phase out. To make up for the gap left by coal generation, meet growing demand and meet renewable energy targets, the province is expected to heavily invest in wind generation in the coming years. Our analysis shows that converting some of the stranded coal capacity in the province to fire forest residue biomass may reduce necessary capital investments in wind generation while allowing stranded units to operate past the 2030 phase out deadline. By allowing 900 MW of coal to biomass conversion in the province, the government could forgo up to $ 600 million in incentive payments to renewable generators by 2030, while system investment costs in new generation would decrease by $ 2.6 billion by the same date.
Niet, T., Lyseng, B., English, J., Keller, V., Palmer-Wilson, K., Moazzen, I., Robertson, B., Wild, P., Rowe, A. (2017). Hedging the risk of increased emissions in long term energy planning. Energy Strategy Reviews, vol. 16, pp. 1–12, Jun. 2017.
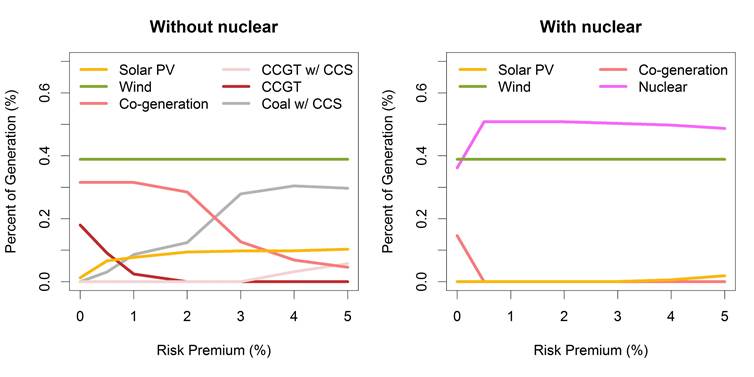
The feasibility of meeting emission targets is often evaluated using long range planning optimization models in which the targets are incorporated into the system constraints. These models typically provide one ‘optimal’ solution that considers only a deterministic representative value of emissions for each technology and do not consider the risk of exceeding expected emissions for a given optimal solution. Since actual emissions for any given technology are uncertain, implementation of such an optimal solution carries inherent risk that emissions will exceed the given target. In this paper, we implement a stochastic risk structure into the OSeMOSYS optimization model to incorporate uncertainty related to the emissions of electricity generation technologies. For a given risk premium, defined as the additional amount that society is willing to pay to reduce the risk of exceeding the cost optimal system emissions, we determine the generation technology mix that has the lowest risk of exceeding this baseline. We focus on emissions risk since the literature on emissions risk is sparse while the literature on other risks such as policy risks, financial risks and technological risks is extensive.
We apply the model to a case study of a primarily fossil based jurisdiction and find that, when risk is incorporated, solar and wind technologies are built out seven and five years earlier respectively and that carbon free technologies such as coal with carbon capture and storage (CCS) become effective alternatives in the energy mix when compared to the ‘optimal’ solution without consideration of risk, though this does not include the risk of carbon leakage from CCS technologies. If nuclear is included as a generation option, we find that nuclear provides an effective risk hedge against exceeding emissions.
Lyseng, B., Rowe, A., Wild, P., English, J., Niet, T., and Pitt, L. (2015). Decarbonising the Alberta power system with carbon taxes. Energy Strategy Review (2016), pp. 40-52
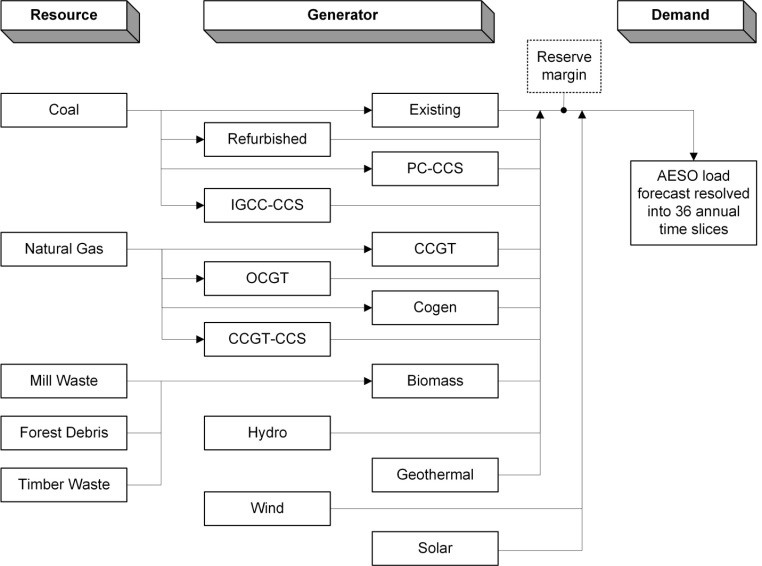 Comparable to many systems in the world, power generation in the Canadian province of Alberta relies primarily on coal. Retiring assets and demand growth will require significant capacity additions, concurrent with pressure to reduce GHG emissions. A techno-economic optimisation model of the Alberta power system is developed in OSeMOSYS to explore the impact of carbon taxes to 2060. Ten tax scenarios are simulated and the subsequent costs, emissions, and generation mixes are compared. Carbon taxes speed up the decarbonisation process – although with decreasing effectiveness – and the system settles on similar carbon intensities by 2060, even in the absence of additional policy. Modest carbon taxes ($30/tCO2) accelerate the transition from coal to natural gas for baseload generation, providing cost-effective reductions. Additional methane leakage from increased use of natural gas does not negate the GHG benefits of reduced coal combustion. Natural gas-fired capacity provides valuable dispatchable generation, even if substantial build-out of wind and solar power occurs. Pulverised coal with CCS becomes economic in all scenarios; natural gas with CCS is installed exclusively in the two most aggressive carbon tax scenarios. Near-term carbon policy in Alberta and other coal-based power systems should focus on accelerating the retirement of coal plants. LINK HERE.
Lyseng, B., and Pitt, L. (2016). Alberta's Carrot and Stick Approach to GHG Emissions Reductions. Policy Options, March 29, 2016
Alberta’s new Climate Leadership Plan aims to reduce emissions from the electricity sector with a “stick and carrot” approach. The stick is a tax on carbon emissions, and the carrot is incentives for renewable generation in the form of renewable energy credits (RECs). The target of eliminating coal fired generation and increasing renewable generation to 30% of the mix by 2030 is possible with different tax and REC combinations. A high tax rate (“Big Stick”) requires lower REC values to meet the target, while a low tax rate (“Small Stick”) requires higher RECs to achieve a similar system. Alberta appears to be favouring the Small Stick alternative where the tax will be paid on a portion of a plant’s carbon emissions. However, this will likely not generate sufficient revenue to fund the REC payments for renewables. Therefore tax revenue from other sector(s) will need to be funneled to the electricity sector in order to maintain the stated goal of ‘revenue neutrality’.
Moazzen, I. (2016), Matlab Tools for Time-Series Analysis and Forecast, Portfolio Optimization and Latin Hypercube Sampling. Matlab File Exchange
Time Series Analysis and Forecast (TSAF), MATLAB Central File Exchange.
 TSAF is a free MATLAB toolbox developed to analyze time series and forecast the future. Time-domain and frequency-domain plots along with the autocorrelation and partial autocorrelation graphs enable user to evaluate existence of trend or seasonality and also to identify a particular behaviour in a given time series. TSAF can fit observed time series to ARIMA models which can be used either to better understand the data or predict future points in the time series. TSAF also features advanced settings such as batch fit and customized filtering. For more information on TSAF, please watch our YouTube videos. TSAF is available on MathWorks. (Photos courtesy of and copyright Free Range Stock, www.freerangestock.com)
Portfolio Optimization, MATLAB Central File Exchange.
 Portfolio optimization is a mathematical approach that provides a trade-off between expected profit and risk and commonly used to make investment decisions across a collection of financial assets. A quick review of this technique along with an application in energy systems is presented in this document. The associated MATLAB code is available on MathWorks. (Image courtesy of jscreationzs at FreeDigitalPhotos.net.)
Latin Hypercube Sampling for Correlated Random Variable, MATLAB Central File Exchange.
 Latin Hypercube Sampling (LHS) is a statistical method to generate a sampling set from a multidimensional distribution. In contrast to memoryless random sampling (Monte Carlo) in which new sample points are generated without taking into account the previously generated sample points, LHS has memory to ensure only one sample is drawn from each stratification. To learn more about this topic, please watch our YouTube videos. To generate different realizations of correlated random variables using LHS method, a MATLAB function is developed which is available on MathWorks.
Niet, T., Pitt, L., Rowe, A., and Wild, P. (2016). Storage and the Shift to Low Carbon Energy. Journal of Clean Energy Technologies, 4(1), 26 – 31.
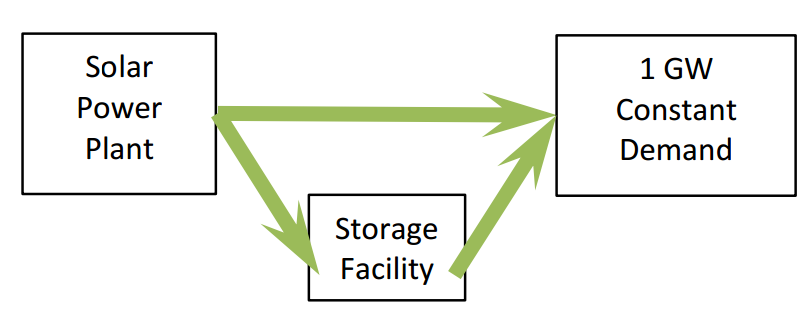 This work looks at the impact of assumptions made regarding efficiency of storage systems used with variable energy resources and how this applies to a solar PV installation. To find the optimal storage system to work with the cyclic solar output, a linear optimization model is implemented using OSeMOSYS. With 100% efficient, free storage, with no capacity restrictions, it is possible to get down to almost 5 GW of required solar installed capacity, but it requires 1.1 TWh of 100% efficient storage. Existing pumped hydro storage facilities have efficiencies between 70 and 80%, which increase these numbers to 7 GW and 1.2 TWh. With a storage model based on the world’s largest pumped hydro facility between 20 and 25 GW of installed solar capacity are required plus between 15 and 30 GWh of storage capacity to meet the 1 GW load. The capital infrastructure required to allow a solar installation to meet that of a baseload plant is therefore around an order of magnitude larger than what is commonly assumed. A shift away from fossil fuels to renewable/variable energy resources will require more infrastructure than indicated by simply considering the capacity factor of the energy source.
Chassin, D., Stroustrup, J., Agathoklis, P. and Djilali, N. (2015). A new thermostat for real-time price demand response: Cost, comfort and energy impacts of discrete-time control without deadband. Applied Energy, 155(4), 816-825
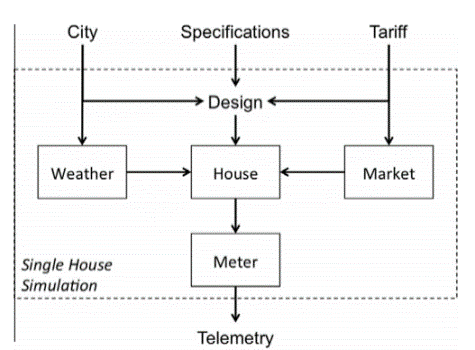 Thermostatically controlled electrical loads can provide valuable energy storage and are prime candidates for fast acting demand response (DR) that can be used to mitigate highly variable renewable power generation and limited availability of ramping resources. When conventional thermostats are retrofitted for real-time price DR control, significant control errors can arise, particularly in the form of dispatch control drift. This paper identifies the underlying causes and presents a new residential thermostat design that enables accurate aggregate load control. The new design gives rise to linear time-invariant models of aggregate load control and demand response, which facilitate the design of highly accurate load-based regulation services for electricity interconnections. Detailed simulation and performance studies coupling a residential house and feeder models are presented to show how consumer comfort and cost savings are achieved and how energy use is impacted for cities in three different climatic zones. During peak times, the new thermostat imparts the entire residential load an energy demand elasticity of about 10–25%. Larger demand elasticities could be achieved by extending the control strategy to other residential thermostatic loads. The proposed thermostat design can operate in the real-time distribution capacity auction system and can provide all the benefits associated with transactive systems, and in particular facilitate increased integration of renewable resources.
Moazzen, I., Robertson, B., Wild, P., Rowe, A., and Buckham, B. (2015).Impacts of Large-Scale Wave Integration into a Transmission-Constrained Grid. Journal of Renewable Energy, in submission
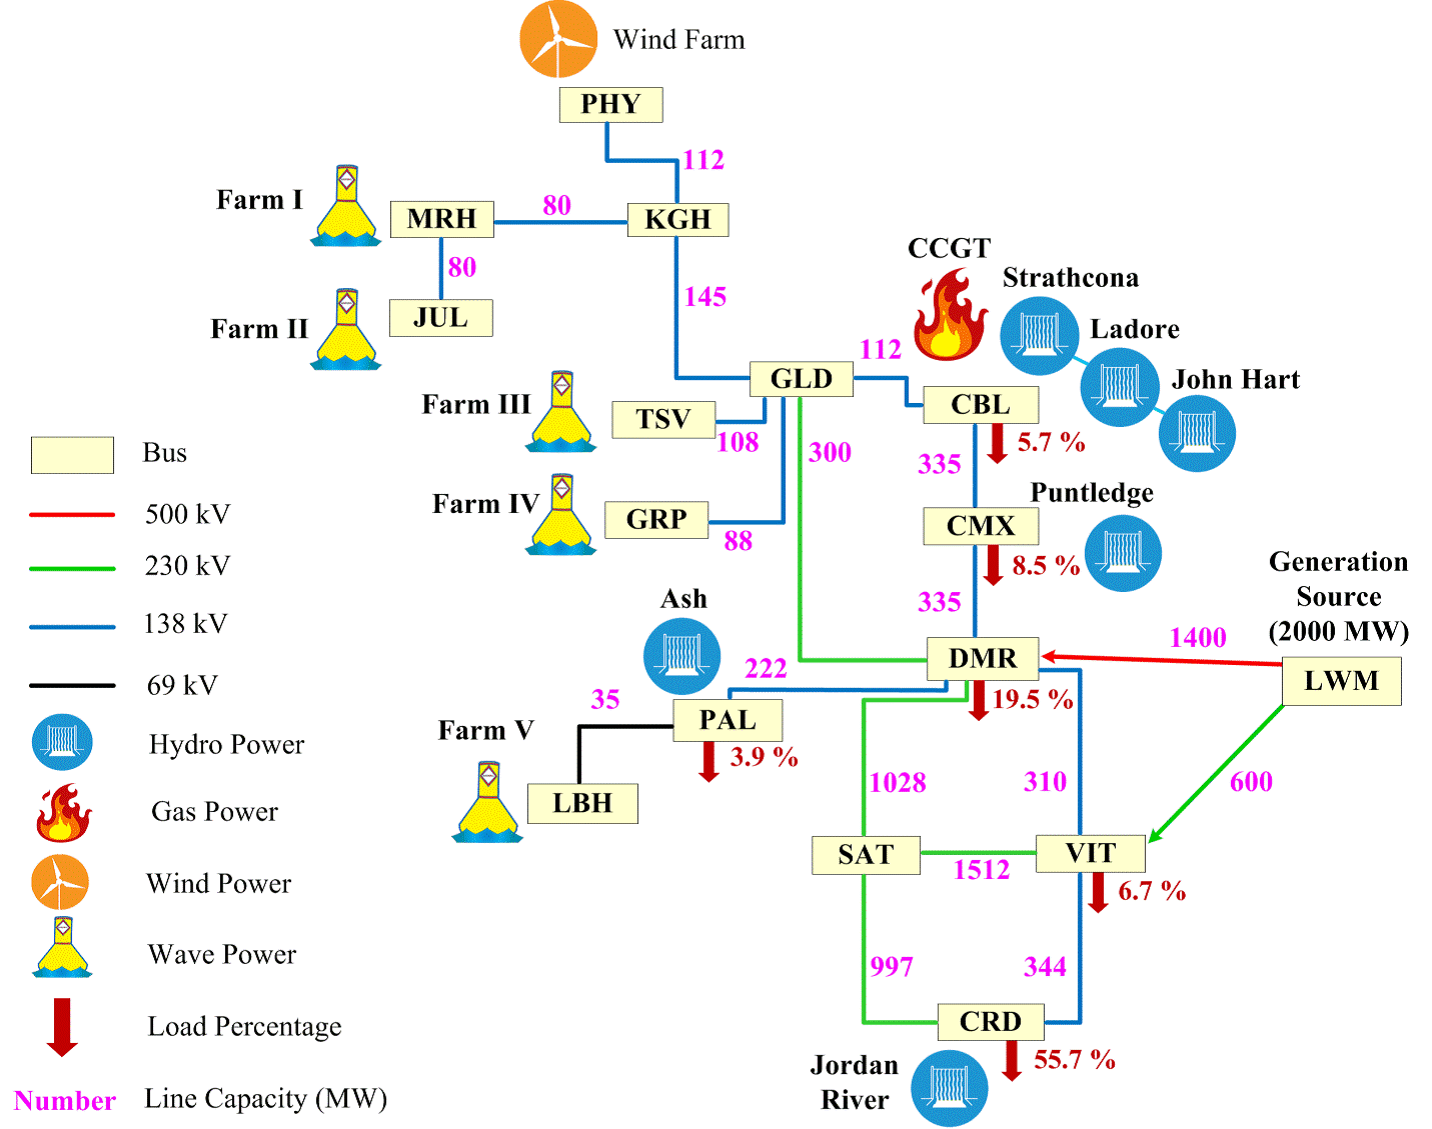 This paper presents a study of large-scale wave energy integration in which transmission constraints are considered. The Vancouver Island electrical grid is considered and is modelled using PLEXOS® Integrated Energy Model software. The model incorporates the current transmission grid, the existing fleet of main generation stations and ten potential wave farm sites with a total generation capacity of 500 MW. The objectives are to investigate: 1) the potential contribution of wave power toward energy self-sufficiency, 2) the effects of transmission constraints on the viability of alternative wave farm sites, 3) the impacts of wave integration on the load profile. Findings suggest that wave energy integration can significantly reduce the energy dependency on neighboring jurisdictions but the current grid infrastructure is not adequate to fully support 500 MW of wave power. In this regard, it is shown that potential wave power integration can significantly benefit from transmission expansion for particular pathways. Further, results illustrate that wave integration leads to periodic (and therefore predictable) reduction in the monthly energy consumed in the grid. This periodic trend is particularly important for hydro-dominated (energy-limited) grid where water level in reservoirs is managed on monthly and yearly basis.
Parkinson, S. C., and Djilali, N. (2015). Long term energy planning with uncertain environmental metrics. Applied Energy, 147(4), 402-412.
 Environmental performance (EP) uncertainties span a number of energy technology options, and pose planning risk when the energy system is subject to environmental constraints. This paper presents two approaches to integrating EP uncertainty into the long-term energy planning framework. The methodologies consider stochastic EP metrics across multiple energy technology options, and produce a development strategy that hedges against the risk of exceeding environmental targets. Both methods are compared within a case study of emission-constrained electricity generation planning in British Columbia, Canada. The analysis provides important insight into model formulation and the interactions with concurrent environmental policy uncertainties. EP risk is found to be particularly important in situations where environmental constraints become increasingly stringent. Model results indicate allocation of a modest risk premium in these situations can provide valuable hedging against EP risk.
Parkinson, S. C., and Djilali, N. (2015). Robust response to hydro-climatic change in electricity generation planning. Climatic Change, 130(4), 475-489.
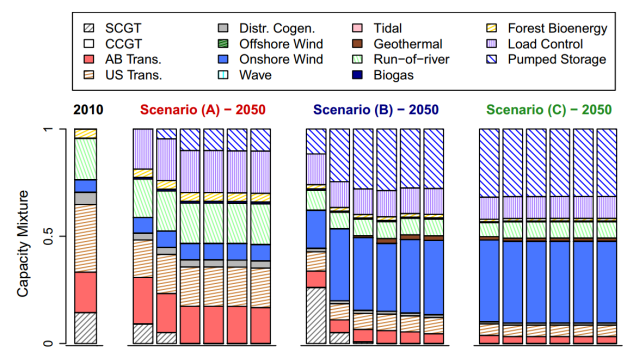
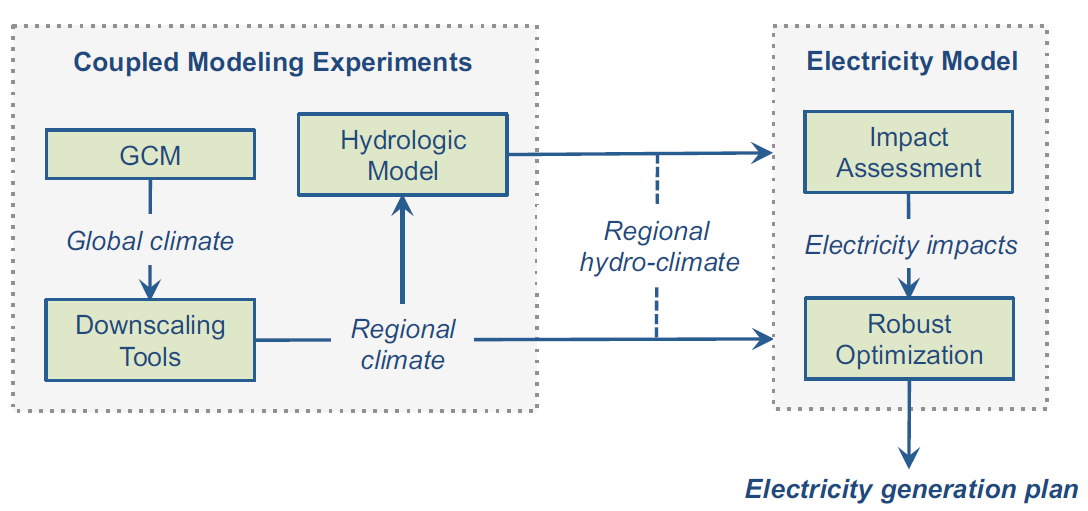 An electricity generation planning framework incorporating adaptation to hydroclimatic change is presented. The planning framework internalizes risks and opportunities associated with alternative hydro-climate scenarios to identify a long-term system configuration robust to uncertainty. The implications of a robust response to hydro-climatic change are demonstrated for the electricity system in British Columbia (BC), Canada. Adaptation strategy is crucial in this region, mainly due to the large contribution of hydropower resources to regional electricity supply. Analysis of results from basin-scale hydrologic models driven with downscaled global climate data suggest that shifts in regional streamflow characteristics by the year 2050 are likely to increase BC’s annual hydropower potential by more than 10 %. These effects combined with an estimated decrease in electricity demand by 2 % due to warmer temperatures, could provide an additional 11 TWh of annual energy. Uncertainties in these projected climate impacts indicate technology configurations offering significant long-term operational flexibility will be needed to ensure system reliability. Results from the regional long-term electricity generation model incorporating adaptive capacity show the significant shifts required in the non-hydro capacity mix to ensure system robustness cause an increase in cumulative operating costs of between 1 and 7 %. Analysis of technology configurations involving high-penetrations of wind generation highlights interactions between flexibility requirements occurring over multiple temporal scales.
Reikard, G., Robertson, B., and Bidlot, J. R. (2015). Combining wave energy with wind and solar: Short-term forecasting. Renewable Energy, 81, 442-456.
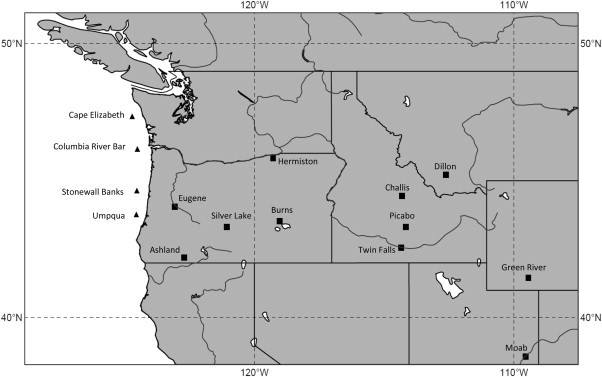 While wind and solar have been the leading sources of renewable energy up to now, waves are increasingly being recognized as a viable source of power for coastal regions. This study analyzes integrating wave energy into the grid, in conjunction with wind and solar. The Pacific Northwest in the United States has a favorable mix of all three sources. Load and wind power series are obtained from government databases. Solar power is calculated from 12 sites over five states. Wave energy is calculated using buoy data, simulations of the ECMWF model, and power matrices for three types of wave energy converters. At the short horizons required for planning, the properties of the load and renewable energy are dissimilar. The load exhibits cycles at 24 h and seven days, seasonality and long-term trending. Solar power is dominated by the diurnal cycle and by seasonality, but also exhibits nonlinear variability due to cloud cover, atmospheric turbidity and precipitation. Wind power is dominated by large ramp events irregular transitions between states of high and low power. Wave energy exhibits seasonal cycles and is generally smoother, although there are still some large transitions, particularly during winter months. Forecasting experiments are run over horizons of 1e4 h for the load and all three types of renewable energy. Waves are found to be more predictable than wind and solar. The forecast error at 1 h for the simulated wave farms is in the range of 5e7 percent, while the forecast errors for solar and wind are 17 and 22 percent. Geographic dispersal increases forecast accuracy. At the 1 h horizon, the forecast error for large-scale wave farms is 39e49 percent lower than at individual buoys. Grid integration costs are quantified by calculating balancing reserves. Waves show the lowest reserve costs, less than half wind and solar.
Ouellette, A., Rowe, A., Sopinka, A., and Wild, P. (2014). Achieving emissions reduction through oil sands cogeneration in Alberta’s deregulated electricity market. Energy Policy, 71, 13-21.
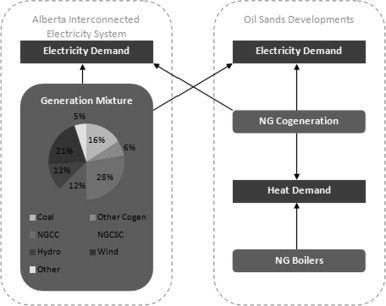 The province of Alberta faces the challenge of balancing its commitment to reduce CO2emissions and the growth of its energy-intensive oil sands industry. Currently, these operations rely on the Alberta electricity system and on-site generation to satisfy their steam and electricity requirements. Most of the on-site generation units produce steam and electricity through the process of cogeneration. It is unclear to what extent new and existing operations will continue to develop cogeneration units or rely on electricity from the Alberta grid to meet their energy requirements in the near future. This study explores the potential for reductions in fuel usage and CO2 emissions by increasing the penetration of oil sands cogeneration in the provincial generation mixture. EnergyPLAN is used to perform scenario analyses on Alberta’s electricity system in 2030 with a focus on transmission conditions to the oil sands region. The results show that up to 15–24% of CO2 reductions prescribed by the 2008 Alberta Climate Strategy are possible. Furthermore, the policy implications of these scenarios within a deregulated market are discussed.
Sopinka, A., and Pitt, L. (2014). Taming WECC's Carbon Diet: Are We Losing Weight Yet?. The Electricity Journal, 27(8), 96-104.
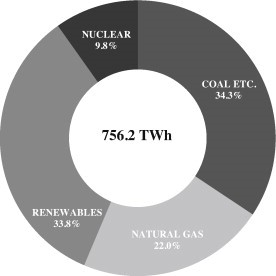 The North American bulk power system is comprised of four interconnected regions: the Western Interconnect, the Eastern Interconnect, Texas, and Quebec. Arguably, the largest and most diverse of those areas is the Western Interconnect, which spans from northern Alberta and British Columbia in Canada to the Baja California peninsula in Mexico and includes all or part of 14 U.S. states in between. The varied geography and geology of the region creates a wide range of possible energy sources. The Pacific Northwest is dominated by mountains and rivers and therefore has many large storage hydroelectric facilities. The interior portion of the Western Interconnect that runs from Alberta southward has substantial coal and natural gas deposits and these areas tend to have a higher proportion of fossil fuel capacity and generation. Several U.S. states within the region have nuclear generating capacity; however, the use of this technology is prohibited in British Columbia and the province of Alberta currently has no plans to introduce nuclear electricity production into its generation mix. Low-carbon energy sources, particularly the variable energy resources (VER) of wind, solar, and run-of-river technologies, are increasingly the focus of WECC policymakers, fostered by the underlying conviction that adding zero-carbon resources will reduce emissions in the electricity sector. In the work that follows, we roughly estimate the quantity of carbon abatement expected from state and provincial policies that are designed at increasing low-carbon capacity and generation. We do not consider the carbon production impacts of connecting VERs to the grid or of firming their output once they enter service, both of which would have the effect of raising the cost of CO2 abatement with the addition of VERs. In addition, we provide a lower bound on the cost of reducing emissions in a system with significant low-carbon assets.
Sopinka, A., and Pitt, L. (2014). The Columbia River Treaty: Fifty Years After the Handshake. The Electricity Journal, 27(4), 84-94.
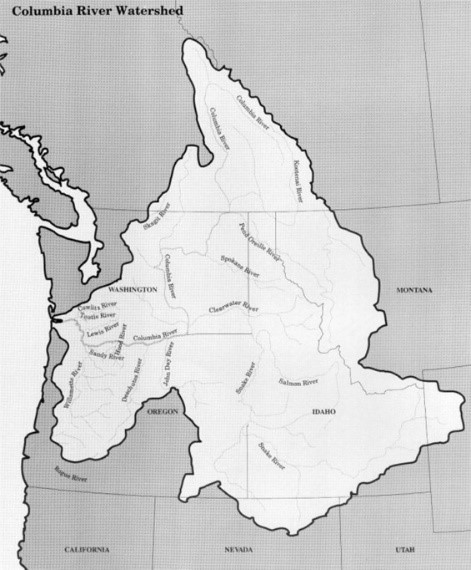 The Columbia River Treaty requires coordinated water flows between Canada and the U.S. to improve power generation and provide flood control. In September 2014 either country can announce their desire to terminate participation in the Treaty. Already there appears to be a significant chasm between the entities with respect to how they will allocate the costs and benefits associated with future coordinated operations. The Columbia River is the fifteenth-longest river in North America, winding its nearly 2,000 km length through both Canada and the U.S. Approximately 15 percent of the river’s 669,300 km2 basin is located in Canada, although due to the elevation and geography, the Canadian portion of the river contributes approximately 35 percent of the annual average flow and up to 50 percent of total annual peak flows. In all, the Columbia River discharges 244 billion cubic meters or 198 million acre feet (Maf) annually, which makes it the third-largest in North America in terms of river mouth flow rate, after the Mississippi and St. Lawrence rivers (Dai and Kevin, 2002). However, its unregulated flow rates are highly variable; flow at the Canadian border can range from 14 to 555 thousand cubic feet per second (kcfs). U.S. measurements are taken at The Dalles, Ore., and can vary from 36 to 1,240 kcfs (BPA, 2011). A map of the Columbia Basin is shown in Figure 1.