Many jurisdictions around the world and within Canada have established targets to decarbonize fossil fuel dependent economies. In British Columbia, for example, the Climate Leadership Plan sets a target for all new buildings to be net-zero ready* by 2032. A “net-zero”, or “zero-energy”, building consumes the same amount of electricity annually as it harvests from renewable energy sources. The city of Vancouver’s Renewable City Strategy mandates that all new buildings must reach zero emissions by 2030 and that all energy consumed in Vancouver must come from renewable sources by 2050, including the energy to heat buildings. This Strategy will likely lead to widespread electrification of building heating systems and increased demand for on-site renewable electrical energy. The decreasing capital cost and modular nature of solar photovoltaics (PV) makes it a prime candidate to meet this increasing demand [1]. While a significant buildout of solar PV may enable Vancouver to meet its climate objectives, the impact of this buildout on the balance of the electrical system is not well understood.
Distributed solar PV provides value to the electricity system but its variability can create challenges. For example, as the sun appears from behind a cloud, there is a rapid and unpredictable increase in generation from PV systems, in response to which other generators must decrease output so that that total generation remains equal to demand. If these generators cannot decrease their output either far or fast enough, total power generation available on the system will exceed demand. In the absence of storage, the output of one or more generators will be reduced or “curtailed” and, often, the curtailed energy is renewable.
The California independent system operator (CAISO) boasts a target of 50% renewable penetration by the year 2030 [2] and has a long term goal to achieve 100% penetration [3]. When talking about renewable targets, it is important to understand the difference between energy penetration and capacity penetration. Often, as in the case of California, the renewable portfolio standard targets energy penetration, meaning that a given percentage of electricity generation (energy) must come from renewable sources. Capacity penetration, on the other hand, is percent share of installed capacity that is renewable. Note that the definitions of “renewable” varies among jurisdictions.
As of 2016, there was approximately 79 GW of installed generation capacity in California, 8.6 GW of which was solar PV. This means that the capacity penetration of solar PV was approximately 11%. However, capacity penetration can be misleading. Just because there is 8.6 GW of installed PV, doesn’t mean that it will generate 8.6 GW at all times because, even in California, the sun doesn’t always shine! In 2016, the energy penetration of utility solar PV in California was approximately 6%. These values do not include capacity nor generation for plants under 1 MW, meaning that residential solar PV is excluded [4].
California’s ambitious renewable penetration target creates both variability and curtailment challenges. Consider, for example, the “duck curve”, shown in Figure 1, which shows the “net load” which is the load remaining to be served by other generators, after subtracting renewable generation such as wind and solar PV. Examining the 2017 curve, there is an increase of approximately 11 GW from the 13th hour of the day to the 20th hour. For comparison, the record peak electricity demand in BC is 10.1 GW [5]. For reference, BC has approximately 12 GW of total installed generating capacity, 11 GW of which is hydroelectric. This increase in net load in California is equivalent to all hydroelectric generating facilities in BC ramping up from zero to full output over the duration of a single afternoon. While hydroelectric generators tend to be flexible operators, even they are not able to respond to ramps at this scale due to operational and river quality constraints. In California, the generation mix is predominantly natural gas fired, with a capacity penetration of approximately 54%, which is responsible for much of the flexibility that allows for high penetrations of solar PV.
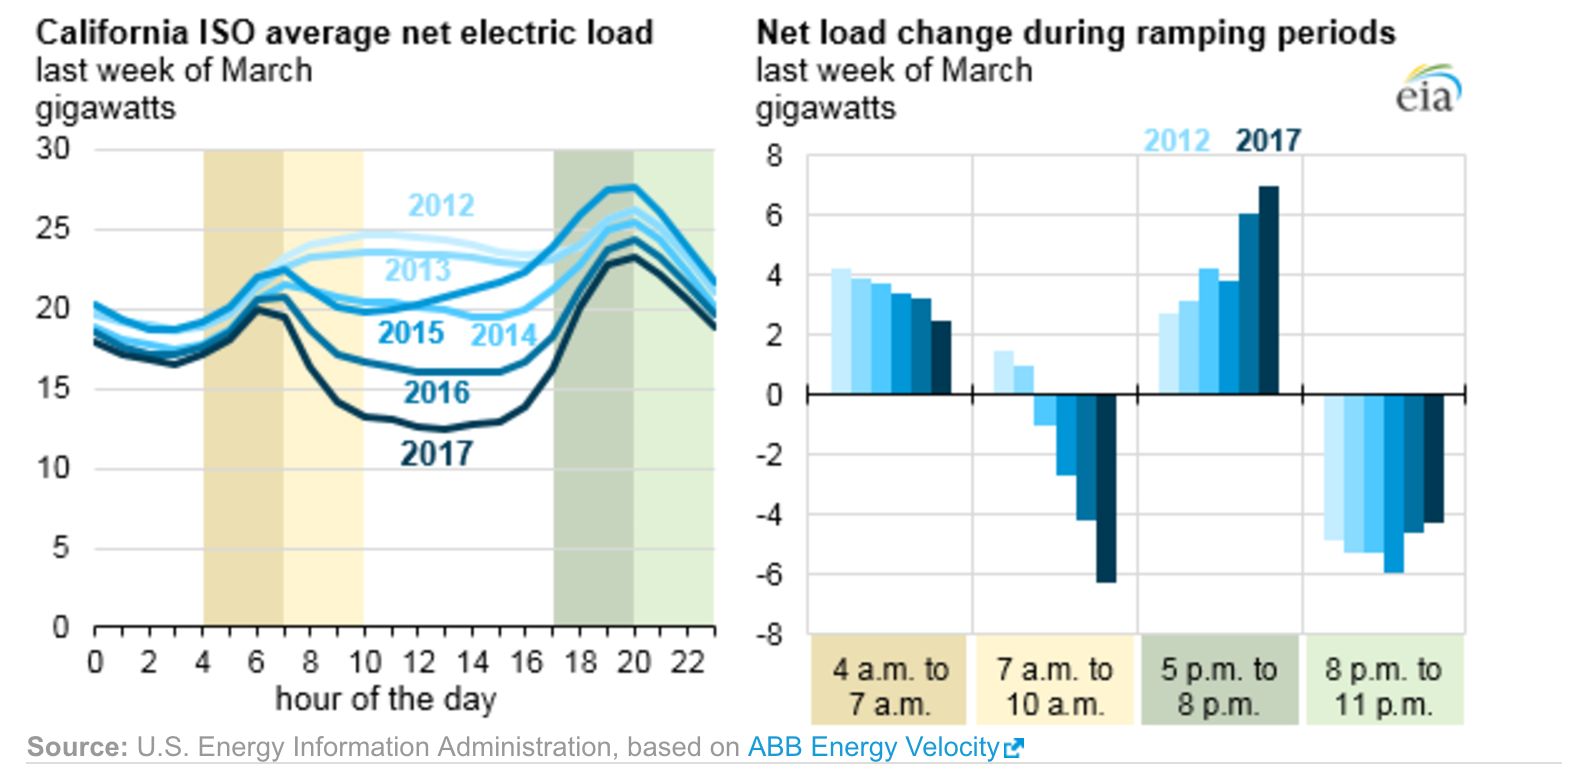
Figure 1: CAISO average net electricity load with color blocked ramping periods and net load change during these times. Shown for the last week of March over the course of 6 years from 2012 to 2017 [6].
In BC, provincial and municipal climate policy initiatives could see rooftop solar penetrations rise to levels similar to those of California. If this were to occur, the BC system would see hourly effects, possibly including net load that follows a “duck curve”. The 2060 Project is conducting a study to assess the potential impacts of future penetrations of distributed solar PV generation on the hydro-based system, here in BC. A series of solar PV capacity penetration scenarios were created to assess possible future system effects.
Solar PV system distribution is determined based on the number of single detached homes in each of four major cities in BC: Vancouver, Victoria, Kelowna, and Prince George, with data obtained from Statistics Canada 2016 Census data. Generation data for a 2.5 kW, a 5 kW, and a 10 kW solar PV system is calculated for a single detached home located in each of these 4 cities. Total PV capacity for each of these cities is then estimated, based on the projected number of single detached homes, as shown in Table 1.
Table 1: Installed PV capacity by city with solar PV system on every single detached home
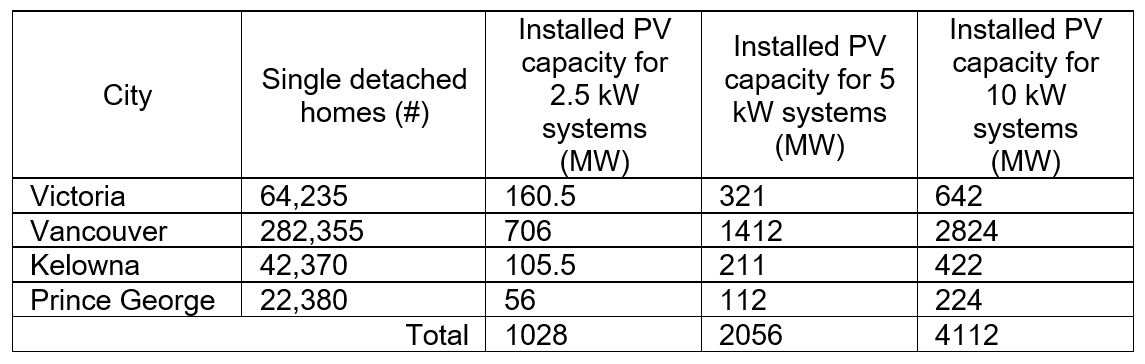
Table 2: Solar PV study scenarios used to simulate an average BC August day in 2016 with ‘overnight’ addition of rooftop solar PV. Scenario name refers to solar PV system size installed on every single detached home in the 4 major population centers: Victoria, Vancouver, Kelowna, and Prince George.
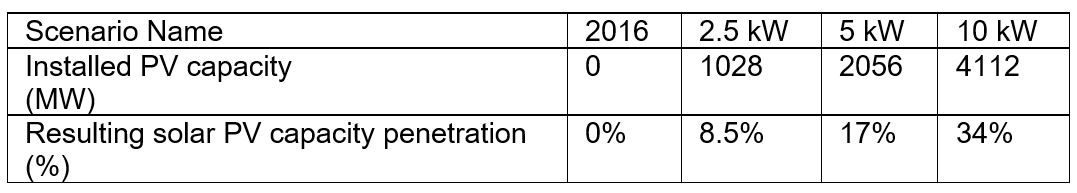
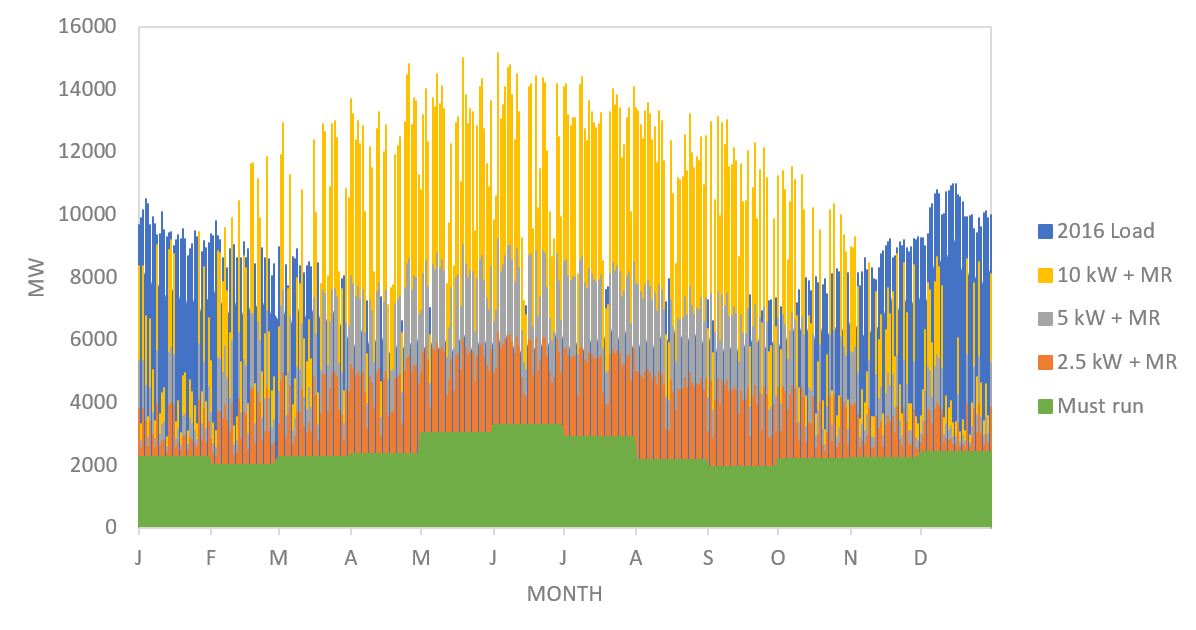
Table 1 is used to create study scenarios, further defined in Table 2, which are used to simulate a typical August day in 2016. Net electric load and net load change during ramping periods are shown in Figure 2. As can be seen in Figure 2, BC could see significant ramping events, especially from 9am-12pm and from 2pm-5pm, which would need to be managed via hydro generation or flexible imports and exports. Examining Figure 2(a), the 10-kW scenario shows overgeneration during midday which would need to be curtailed or sold. The variable nature of solar will require existing system capacity to quickly respond to changes in PV output, thereby constraining the flexibility of the current hydro-based system.
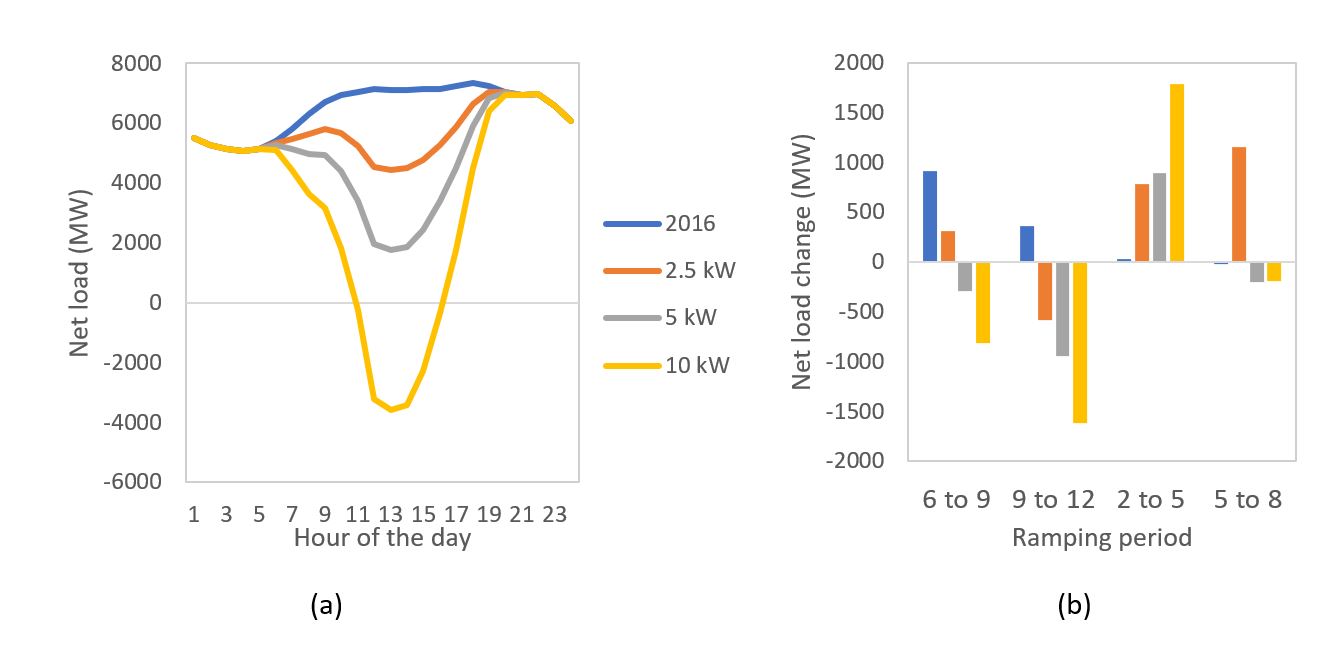
Figure 2: (a) British Columbia net electric load for various solar penetration scenarios for an average August day in 2016. (b) Net load change during ramping periods for various solar penetration scenarios for an average August day in 2016.
While BC would see a “duck curve” at these penetrations, we would also see seasonal effects associated with BC’s hydro dominated system. BC’s domestic load peaks during winter (see blue Load in Figure 3) and is at a low in the mid-summer. However, BC’s hydro-generation potential peaks during the early summer, due to the “freshet” (i.e. the period of snow pack melt that leads to peak river flows). BC’s hydro generation has minimum allowable generation profile, or “must run” generation which is tied to the freshet and operational ability of the existing hydro system. Average monthly must run generation can be seen in green in Figure 3. A significant build-out of solar PV, which is also summer peaking, would increase the energy penetration of PV in the summer months when hydro system operational flexibility is already constrained. To examine the effect of the hourly generation of each solar PV scenario over the course of the year, we “stack” the generation profiles on top of the must run generation profile. At this point, one can see an even more significant amount of overgeneration in Figure 3 when compared to the duck curve in Figure 2.
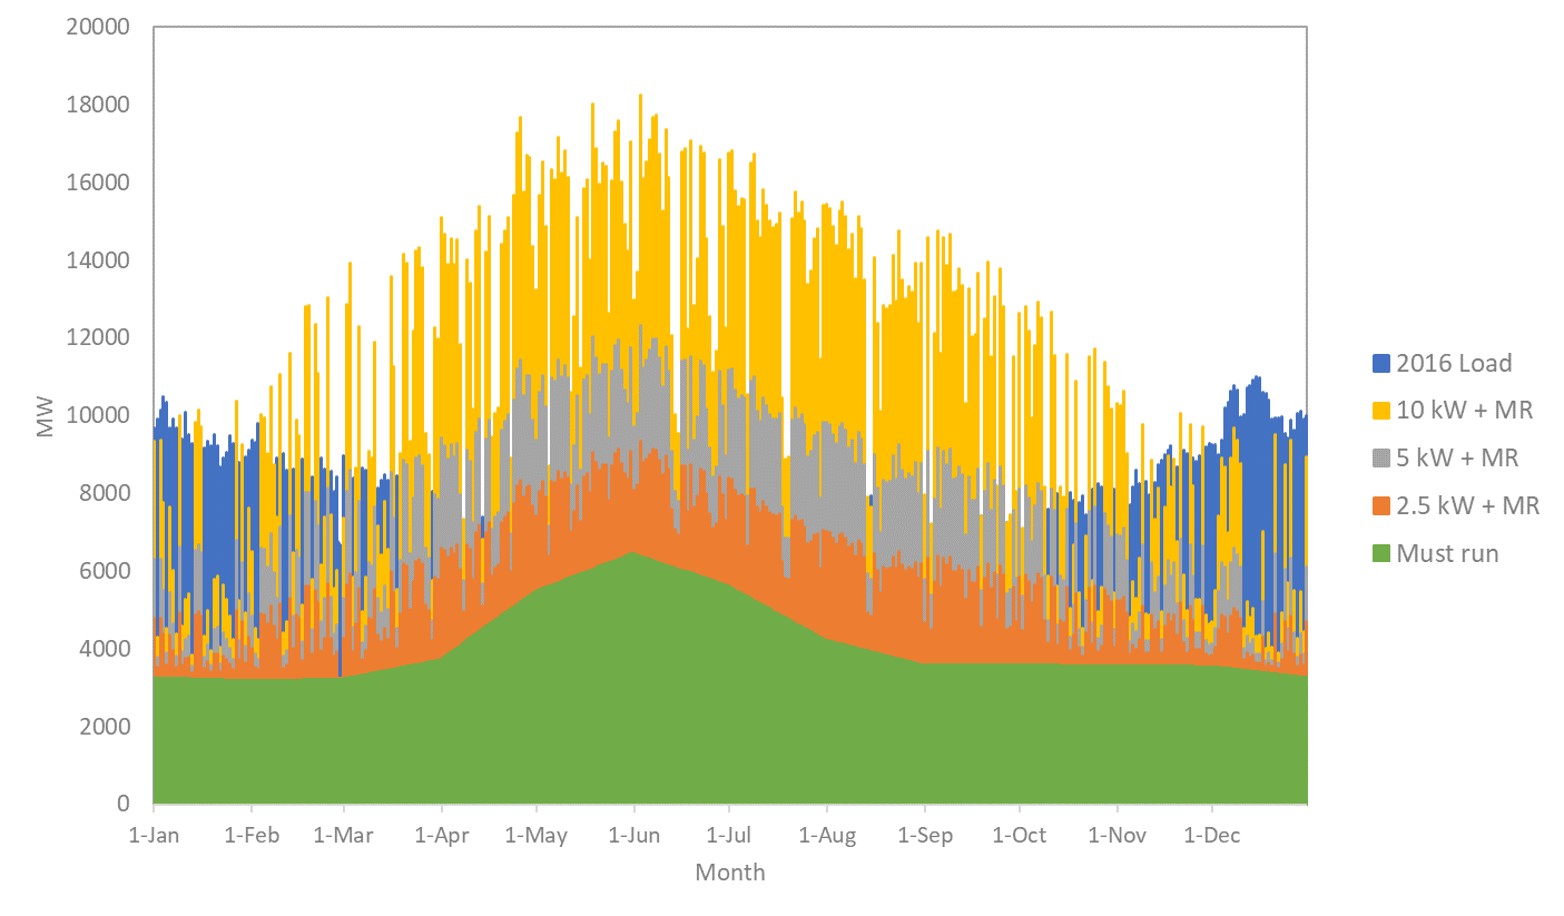 Figure 3: BC 2016 balancing authority load data with solar penetration scenarios yearly generation stacked on top of average monthly minimum allowable hydro generation (must run generation) in BC
While it is clear that solar generation can provide potentially valuable energy to the system, it is important to consider that, at large capacity (and energy) penetrations, ramping events can create flexibility problems for the balance of the system. A common solution to this problem is natural gas generation, but this solution can be at odds with efforts to achieve global and provincial climate targets. Another solution is energy storage via pumped hydro or residential scale battery storage (see Cameron Wade’s blog on household self-sufficiency). Typically, however, these are hourly or daily storage technologies which would not help with seasonal storage needs. A third solution is energy trade with either the US or Alberta. This solution is, however, not always available when needed due to the timing of must-run generation in these jurisdictions
Overall, this research indicates that solar PV can add valuable energy to our electricity system at modest penetrations. However, at the high penetrations that may be required for net-zero cities, we must take a system-level view to fully understand the associated implications and opportunities.
Footnotes
* The BC Climate Leadership Plan states that it aims to encourage the development of net zero buildings by accelerating increased energy requirements in the BC Building Code to take incremental steps to make buildings ready to be net zero by 2032
References
[1] H. K. Trabish, “Do new rooftop solar price projections mean ‘if you can’t beat ’em, join ’em’ for utilities?,” Utility Drive, 1 March 2018. [Online]. Available: https://www.utilitydive.com/news/do-new-rooftop-solar-price-projections-mean-if-you-cant-beat-em-join-e/517786/.
[2] California Public Utilities Commission, “California Renewables Portfolio Standard (RPS),” [Online]. Available: http://www.cpuc.ca.gov/RPS_Homepage/.
[3] Kevin De Leon , “California Senate Leader Introduces 100 Percent Clean Energy Measure,” [Online]. Available: http://sd24.senate.ca.gov/news/2017-05-02-california-senate-leader-introduces-100-percent-clean-energy-measure.
[4] California Energy Commission, “Electric Generation Capacity & Energy,” 2017. [Online]. Available: http://www.energy.ca.gov/almanac/electricity_data/electric_generation_capacity.html.
[5] BC Hydro, “Cold snap drives electricity demand to all-time high,” 4 January 2017. [Online]. Available: https://www.bchydro.com/news/press_centre/news_releases/2017/cold-snap-drives-electricity-demand.html.
[6] U.S. Energy Information Administration , “Today in Energy: California wholesale electricity prices are higher at the beginning and end of the day,” 24 July 2017. [Online]. Available: https://www.eia.gov/todayinenergy/detail.php?id=32172.